Exam 14: Statistical Process Control
Exam 1: Introduction to Supply Chain and Operations Management89 Questions
Exam 2: Supply Chain and Operations Strategy71 Questions
Exam 3: Product and Process Design and Mapping84 Questions
Exam 4: Service Design97 Questions
Exam 5: Customer Relationship Management60 Questions
Exam 6: Strategic Sourcing78 Questions
Exam 7: Supplier Management64 Questions
Exam 8: Demand Management and Forecasting81 Questions
Exam 9: Inventory Management Fundamentals and Independent Demand84 Questions
Exam 10: Sales and Operations Planning and Enterprise Resource Planning115 Questions
Exam 11: Logistics86 Questions
Exam 12: Project Management90 Questions
Exam 13: Supply Chain Quality Management84 Questions
Exam 14: Statistical Process Control80 Questions
Exam 15: New Section76 Questions
Select questions type
Use the information below to answer the following question(s).
An inspector visually inspects 10 samples of 200 computer monitors each for defects.Using trained judgement,the inspector either accepts or rejects the monitors based on whether they are flawless.The table below gives the results of these inspections from the 10 samples:
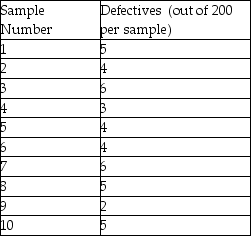 -What is the average proportion defective?
(Multiple Choice)
4.8/5  (33)
(33)
A control chart needs to be developed to determine if the temperature for a process is within control limits.The control chart which would be most appropriate to use in this situation would be the
(Multiple Choice)
4.7/5 (42)
Variation that centers on a mean and occurs with a somewhat consistent amount of dispersion is known as random variation.
(True/False)
4.9/5 (25)
The control chart used to measure the proportion defective is called the u chart.
(True/False)
4.9/5 (24)
A continuous measurement such as weight,height,or volume is known as an attribute.
(True/False)
4.8/5 (42)
The rule that states that sampling distributions generally are normally distributed is known as the ________.
(Short Answer)
4.9/5 (35)
Use the information below to answer the following question(s).
An inspector visually inspects 10 samples of 200 computer monitors each for defects.Using trained judgement,the inspector either accepts or rejects the monitors based on whether they are flawless.The table below gives the results of these inspections from the 10 samples:
-What is the UCL for a p chart?
(Multiple Choice)
4.8/5 (37)
A process that exhibits nonrandom variation is a(n)________ process.
(Short Answer)
4.9/5 (24)
Fifty sample measurements of the length of an automotive component yield a grand mean of 1.33 inches with an estimated standard deviation of 0.2 inches.The specification length is between 1.2 and 1.4 inches.Calculate the process capability index.
(Multiple Choice)
4.7/5 (29)
A comparative measure of the extent to which individual products meet specification is known as ________.
(Short Answer)
4.9/5 (32)
Use the information below to answer the following question(s).Use the "Factors for Control Limits" Table A.3 from the textbook where required:
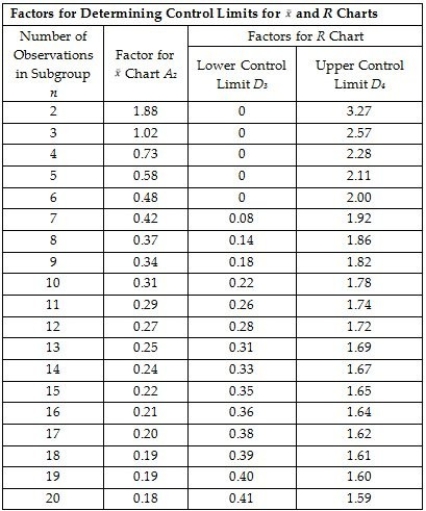 A control chart needs to be developed to determine if the temperature for a process is within control limits.Five samples each having 4 observations are taken and the sample measurements (temperature in degrees F)are noted in the table below:
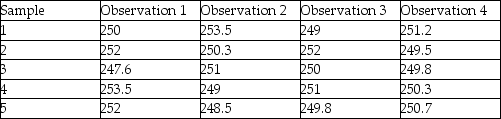 -What is the value of the average range R-bar?
(Multiple Choice)
4.8/5 (41)
The ability of a process to produce a product that meets specification is known as ________.
(Short Answer)
4.9/5 (36)
A process capability measure of 1.00 or below indicates that the process is capable.
(True/False)
4.7/5 (31)
The control chart used to monitor the dispersion of a process is called a(n)________ chart.
(Short Answer)
4.8/5 (30)
A bottling plant measures the volume of liquid in the bottle.The control chart which will be used with such a measurement is a
(Multiple Choice)
4.8/5 (34)
The cost of inspection for three different product characteristics A,B,and C,is $10,$12 and $8 respectively.The cost of failure if any one of them breaks down is $100 (full replacement cost of the product).What is the inspection ratio for B?
(Multiple Choice)
4.8/5 (41)
The control chart used to count the number nonconforming in a consistent sample space is called the c chart.
(True/False)
4.8/5 (37)
For process control charts,using control limits corresponding to z = 3 standard deviations from the mean will capture exactly 95% of random variation.
(True/False)
4.9/5 (34)
Adjusting a process when it only exhibits random variation is called ________.
(Short Answer)
4.8/5 (31)
Filters
- Essay(0)
- Multiple Choice(0)
- Short Answer(0)
- True False(0)
- Matching(0)