Exam 14: Statistical Process Control
Exam 1: Introduction to Supply Chain and Operations Management89 Questions
Exam 2: Supply Chain and Operations Strategy71 Questions
Exam 3: Product and Process Design and Mapping84 Questions
Exam 4: Service Design97 Questions
Exam 5: Customer Relationship Management60 Questions
Exam 6: Strategic Sourcing78 Questions
Exam 7: Supplier Management64 Questions
Exam 8: Demand Management and Forecasting81 Questions
Exam 9: Inventory Management Fundamentals and Independent Demand84 Questions
Exam 10: Sales and Operations Planning and Enterprise Resource Planning115 Questions
Exam 11: Logistics86 Questions
Exam 12: Project Management90 Questions
Exam 13: Supply Chain Quality Management84 Questions
Exam 14: Statistical Process Control80 Questions
Exam 15: New Section76 Questions
Select questions type
For process control charts,to approximately capture 99% of the random variation,the control limits will correspond to ________ standard deviations from the mean.
(Short Answer)
4.8/5  (37)
(37)
A quality manager concludes that a process is stable.This means that
(Multiple Choice)
4.9/5 (31)
A measurement to determine if a defect is either present or not is known as a(n)________.
(Short Answer)
5.0/5 (35)
Fifty sample measurements of the length of an automotive component yield a grand mean of 1.33 inches with an estimated standard deviation of 0.2 inches.The specification length is between 1.2 and 1.4 inches.Is the process capable of meeting the required specifications?
(Multiple Choice)
4.8/5 (33)
The ratio between the cost of inspection and the cost of failure resulting from a particular step in the process is called ________.
(Short Answer)
4.7/5 (30)
Samples which are ordered by time or sequence are called systematic samples.
(True/False)
4.7/5 (41)
On a control chart,one data point out above the control limit is considered normal behavior.
(True/False)
4.9/5 (40)
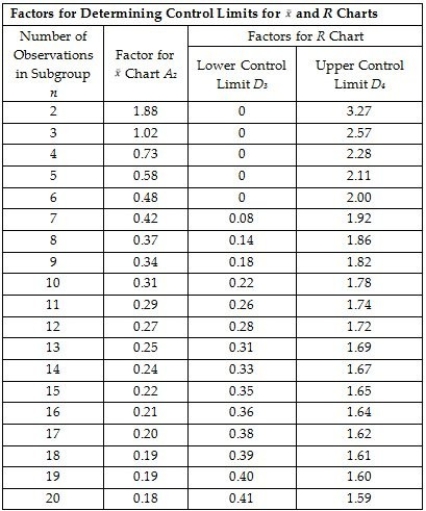
Use the information below to answer the following question(s).Use the "Factors for Control Limits" Table A.3 from the textbook where required:
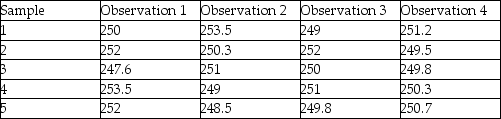
 A control chart needs to be developed to determine if the temperature for a process is within control limits.Five samples each having 4 observations are taken and the sample measurements (temperature in degrees F)are noted in the table below:
 -What is the UCL for a X-bar chart?
(Multiple Choice)
4.9/5 (40)
Use the information below to answer the following question(s).Use the "Factors for Control Limits" Table A.3 from the textbook where required:
A control chart needs to be developed to determine if the temperature for a process is within control limits.Five samples each having 4 observations are taken and the sample measurements (temperature in degrees F)are noted in the table below:
-What is the UCL for a R chart?
(Multiple Choice)
4.9/5 (41)
Every 10th product coming off a production line is inspected to check for quality.Such a sampling technique is called ________.
(Short Answer)
4.7/5 (27)
Data gathered to check if a process is stable is called ________.
(Short Answer)
5.0/5 (36)
For process control charts,using control limits corresponding to z = 3 standard deviations from the mean will capture exactly ________ of random variation.
(Short Answer)
4.9/5 (34)
Aspects of the product that will result in either good or poor function of the product are known as ________.
(Short Answer)
4.9/5 (37)
For process control charts,to approximately capture 99% of the random variation,the control limits will correspond to z = 3 standard deviations from the mean.
(True/False)
4.9/5 (35)
The control chart used to monitor the dispersion of a process is called the
(Multiple Choice)
4.8/5 (37)
The central limit theorem states that sampling distributions generally are ________ distributed.
(Short Answer)
4.9/5 (32)
The control chart used to monitor the average of the characteristic being measured is called an R-chart.
(True/False)
4.8/5 (29)
The control chart used to measure the number of defects per unit is called the
(Multiple Choice)
4.8/5 (30)
Filters
- Essay(0)
- Multiple Choice(0)
- Short Answer(0)
- True False(0)
- Matching(0)