Exam 4: Numerical Descriptive Techniques
Exam 1: What Is Statistics43 Questions
Exam 2: Graphical Descriptive Techniques I93 Questions
Exam 3: Graphical Descriptive Techniques II140 Questions
Exam 4: Numerical Descriptive Techniques316 Questions
Exam 5: Data Collection and Sampling82 Questions
Exam 6: Probability237 Questions
Exam 7: Random Variables and Discrete Probability Distributions277 Questions
Exam 8: Continuous Probability Distributions215 Questions
Exam 9: Sampling Distributions154 Questions
Exam 10: Introduction to Estimation152 Questions
Exam 11: Introduction to Hypothesis Testing187 Questions
Exam 12: Inference About a Population149 Questions
Exam 13: Inference About Comparing Two Populations168 Questions
Exam 14: Analysis of Variance157 Questions
Exam 15: Chi-Squared Tests Optional175 Questions
Exam 16: Simple Linear Regression and Correlation301 Questions
Exam 17: Multiple Regression158 Questions
Select questions type
NARRBEGIN: Salaries of Employees
Salaries of Employees
The following data represent the yearly salaries (in thousands of dollars) of a sample of 13 employees of a firm: 26.5, 23.5, 29.7, 24.8, 21.1, 24.3, 20.4, 22.7, 27.2, 23.7, 24.1, 24.8, and 28.2.NARREND
-{Salaries of Employees Narrative} Compute the median salary.
(Short Answer)
4.9/5  (29)
(29)
What statistics and graphs can you use to answer the following question: Are the observations close to one another, or are they widely dispersed?
(Essay)
4.8/5 (37)
Which measure of central location can be used for both interval and nominal variables?
(Multiple Choice)
4.9/5 (37)
NARRBEGIN: Ages of Retirees
Ages of Retirees
A sociologist recently conducted a survey of retirees over 65 years of age whose net worth is too high to qualify for Medicaid and who have no private health insurance. The ages of 20 uninsured retirees were as follows: 65, 66, 67, 68, 69, 70, 71, 73, 74, 75, 78, 79, 80, 81, 86, 87, 91, 92, 94, and 97.NARREND
-{Ages of Retirees Narrative} What does the value of the first quartile tell you?
(Essay)
4.9/5 (35)
If the first and second quartiles are closer to each other than are the second and third quartiles, the shape of the histogram based on the quartiles is ____________________.
(Short Answer)
4.9/5 (38)
NARRBEGIN: Yearly Donations
Yearly Donations
The following data represent the yearly donations (in thousands of dollars) of a sample of 13 benefactors: 26.5, 23.5, 29.7, 24.8, 21.1, 24.3, 20.4, 22.7, 27.2, 23.7, 24.1, 24.8, and 28.2.NARREND
-{Yearly Donations Narrative} Compute the lower quartile for the donations.
(Essay)
4.7/5 (35)
NARRBEGIN: Hours of Playing Video Ga
Hours of Playing Video Games
Suppose that the following data provide the hours of playing video games per week for a sample of 15 high school students in Roanoke, Virginia: 5, 11, 25, 19, 18, 20, 27, 13, 8, 10, 15, 19, 18, 9, and 12.NARREND
-{Hours of Playing Video Games Narrative} Calculate and interpret the interquartile range.
(Essay)
4.8/5 (38)
NARRBEGIN: Weights of Workers
Weights of Workers
The following data represent the number of employees of a sample of 25 companies: 164, 148, 137, 157, 173, 156, 177, 172, 169, 165, 145, 168, 163, 162, 174, 152, 156, 168, 154, 151, 174, 146, 134, 140, and 171.NARREND
-{Weights of Workers Narrative} Find the median number of workers.
(Short Answer)
4.8/5 (35)
The median of an ordered data set with 30 items would be the average of the 15th and the 16th observations.
(True/False)
4.8/5 (36)
NARRBEGIN: Credit Hours
Credit Hours
The College of Business at The State University of California produced 3,400 credit hours during Spring Semester, 2011he number and percentage of credit hours produced by each of the four departments in the College of Business is shown below. Department Percent Count Marketing 35.3 1.200 Management 23.5 800 Finance 23.5 800 Accounting 17.6 600 The following three-dimensional pie chart was constructed from the table above. 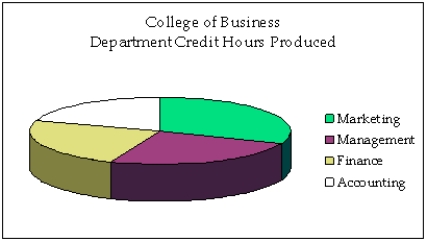 NARREND
-{Credit Hours Narrative} Construct a two-dimensional pie chart showing the percentages of credit hours produced by the four departments.
NARREND
-{Credit Hours Narrative} Construct a two-dimensional pie chart showing the percentages of credit hours produced by the four departments.
(Essay)
4.7/5 (30)
NARRBEGIN: Home Care
Home Care
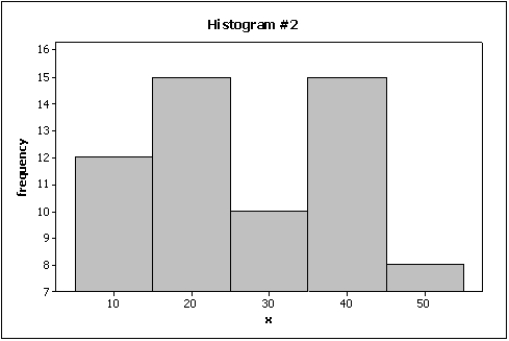
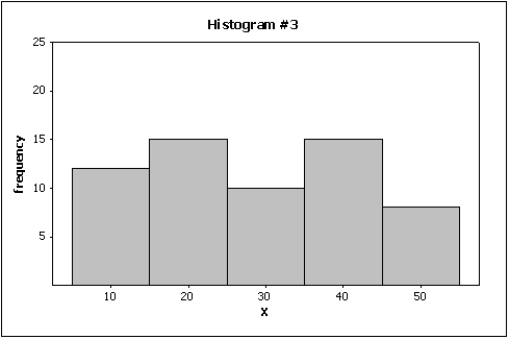
Data are collected on the number of house calls (x) made in a given week by each of 60 nurses in a certain hospital. The same data set is displayed in each of the three histograms below. 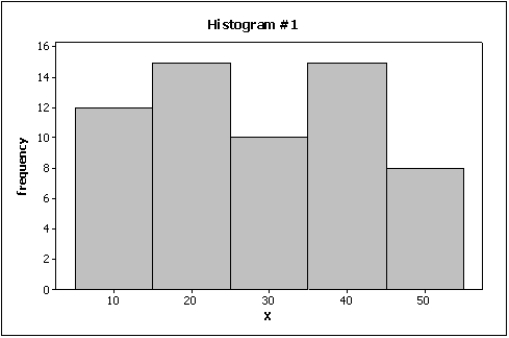
 NARREND
-{Home Care Narrative}Which graph do you think is the most appropriate display? Justify your answer.
NARREND
-{Home Care Narrative}Which graph do you think is the most appropriate display? Justify your answer.
(Essay)
4.7/5 (39)
The coefficient of variation allows us to compare two sets of data based on different measurement units.
(True/False)
4.8/5 (26)
Suppose a sample of size 50 has a sample mean of 20. In this case, the sum of all observations in the sample is 1,000.
(True/False)
4.9/5 (32)
NARRBEGIN: Weights of Police Officer
Weights of Police Officers
The following data represent the weights in pounds of a sample of 25 police officers: 164, 148, 137, 157, 173, 156, 177, 172, 169, 165, 145, 168, 163, 162, 174, 152, 156, 168, 154, 151, 174, 146, 134, 140, and 171.NARREND
-{Weights of Police Officers Narrative} Determine the location and value of the 60th percentile of the weights.
(Essay)
4.9/5 (39)
Which measure of central location is meaningful when the data are ordinal?
(Multiple Choice)
4.8/5 (34)
If cov(x, y) = 20, and then the sample coefficient of correlation r is:
(Multiple Choice)
4.9/5 (39)
NARRBEGIN: Weights of Police Officer
Weights of Police Officers
The following data represent the weights in pounds of a sample of 25 police officers: 164, 148, 137, 157, 173, 156, 177, 172, 169, 165, 145, 168, 163, 162, 174, 152, 156, 168, 154, 151, 174, 146, 134, 140, and 171.NARREND
-{Weights of Police Officers Narrative}
a.Construct a box plot for the weights.
b.Are there any extreme values?
c.What does the box plot tell you about the distribution of the data?
(Essay)
4.9/5 (35)
In symmetric data, the value for Q2 is always halfway between Q1 and Q3.
(True/False)
4.8/5 (36)
The interquartile range is found by taking the difference between the 1st and 3rd quartiles and dividing that value by 2.
(True/False)
4.8/5 (45)
Filters
- Essay(0)
- Multiple Choice(0)
- Short Answer(0)
- True False(0)
- Matching(0)