Exam 4: Numerical Descriptive Techniques
Exam 1: What Is Statistics43 Questions
Exam 2: Graphical Descriptive Techniques I93 Questions
Exam 3: Graphical Descriptive Techniques II140 Questions
Exam 4: Numerical Descriptive Techniques316 Questions
Exam 5: Data Collection and Sampling82 Questions
Exam 6: Probability237 Questions
Exam 7: Random Variables and Discrete Probability Distributions277 Questions
Exam 8: Continuous Probability Distributions215 Questions
Exam 9: Sampling Distributions154 Questions
Exam 10: Introduction to Estimation152 Questions
Exam 11: Introduction to Hypothesis Testing187 Questions
Exam 12: Inference About a Population149 Questions
Exam 13: Inference About Comparing Two Populations168 Questions
Exam 14: Analysis of Variance157 Questions
Exam 15: Chi-Squared Tests Optional175 Questions
Exam 16: Simple Linear Regression and Correlation301 Questions
Exam 17: Multiple Regression158 Questions
Select questions type
NARRBEGIN: Experience and Salary
Longevity and Salary
A sample of eight observations of variables x (years of experience) and y (salary in $1,000s) is shown below:
5 3 7 9 2 4 6 y 20 23 15 11 27 21 17 14 NARREND
-{Longevity and Salary Narrative} Determine the least squares line, and use it to estimate the value of y for x = 6.
(Essay)
5.0/5  (34)
(34)
In a perfectly symmetric bell shaped "normal" distribution:
(Multiple Choice)
4.8/5 (42)
If two data sets have the same range, the distances from the smallest to largest observations in both sets will be the same.
(True/False)
4.8/5 (38)
Which of the following are measures of the linear relationship between two variables?
(Multiple Choice)
4.7/5 (33)
In a negatively skewed distribution, the mean is smaller than the median and the median is smaller than the mode.
(True/False)
4.8/5 (39)
If , , n = 12, and the slope equals 0.5, then the y-intercept of the least squares line is b0 = 276.08.
(True/False)
4.9/5 (36)
NARRBEGIN: Yearly Donations
Yearly Donations
The following data represent the yearly donations (in thousands of dollars) of a sample of 13 benefactors: 26.5, 23.5, 29.7, 24.8, 21.1, 24.3, 20.4, 22.7, 27.2, 23.7, 24.1, 24.8, and 28.2.NARREND
-{Yearly Donations Narrative}
a.Describe the shape of distribution of donations based on the values of the quartiles.
b.Give a possible reason for the shape of this data set, in terms of donations.
(Essay)
4.8/5 (35)
NARRBEGIN: Ages of Jockeys
Ages of Jockeys
The following data represent the ages in years of a sample of 25 jockeys from a local race track: 31, 43, 56, 23, 49, 42, 33, 61, 44, 28, 48, 38, 44, 35, 40, 64, 52, 42, 47, 39, 53, 27, 36, 35, and 20.NARREND
-{Ages of Jockeys Narrative}
a.Construct a relative frequency histogram for the data.
b.What does the histogram tell you about the distribution of the data?
(Short Answer)
4.7/5 (37)
The units for the standard deviation are the same as the units for the original data (for example, feet, inches, etc.).
(True/False)
4.9/5 (38)
A graph showing trends over time is called a(n) ____________________ chart.
(Short Answer)
4.7/5 (36)
Another word for the mean of a data set is the ____________________.
(Short Answer)
4.9/5 (38)
According to the Empirical Rule, if the data form a bell shaped normal distribution, approximately ____________________ percent of the observations will be contained within 2 standard deviations around the mean.
(Short Answer)
4.8/5 (38)
NARRBEGIN: Ages of Jockeys
Ages of Jockeys
The following data represent the ages in years of a sample of 25 jockeys from a local race track: 31, 43, 56, 23, 49, 42, 33, 61, 44, 28, 48, 38, 44, 35, 40, 64, 52, 42, 47, 39, 53, 27, 36, 35, and 20.NARREND
-{Ages of Jockeys Narrative} Compute the interquartile range of the data, and interpret its meaning.
(Essay)
4.9/5 (32)
A line chart showing the number of crimes in Las Vegas from 2000 to 2005 may exhibit a totally different trend than a line chart showing the crime rate in Las Vegas from 2000 to 2005. (Crime rate is defined as number of crimes per 100,000 people.)
(True/False)
4.8/5 (42)
NARRBEGIN: Hours of Playing Video Ga
Hours of Playing Video Games
Suppose that the following data provide the hours of playing video games per week for a sample of 15 high school students in Roanoke, Virginia: 5, 11, 25, 19, 18, 20, 27, 13, 8, 10, 15, 19, 18, 9, and 12.NARREND
-{Hours of Playing Video Games Narrative} Determine the location and value of the first quartile.
(Essay)
4.8/5 (39)
NARRBEGIN: Home Care
Home Care
Data are collected on the number of house calls (x) made in a given week by each of 60 nurses in a certain hospital. The same data set is displayed in each of the three histograms below. 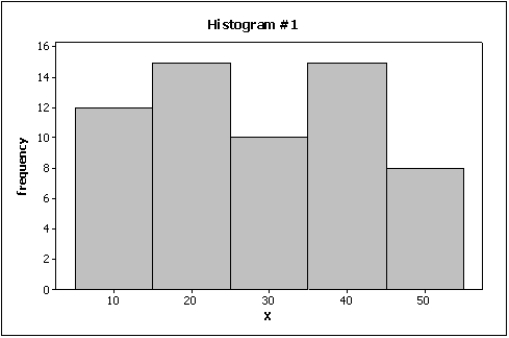
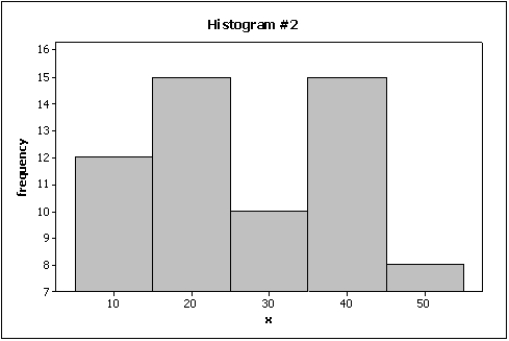
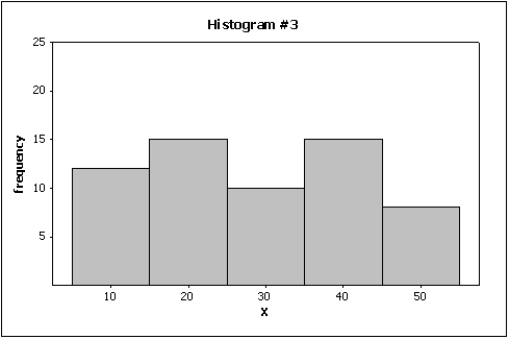 NARREND
-Below are two line charts where the percentage return for a stock is shown over time. The two graphs are made from the same data set.
NARREND
-Below are two line charts where the percentage return for a stock is shown over time. The two graphs are made from the same data set. 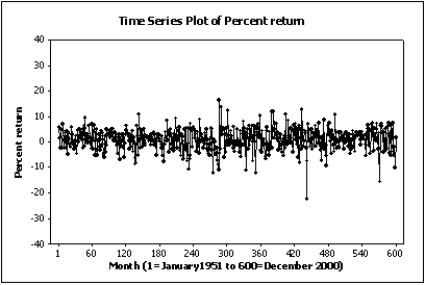
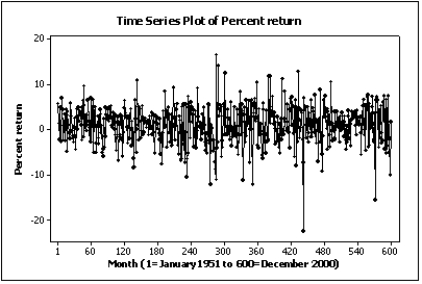 Explain why these two line charts look different.
(Essay)
4.9/5 (30)
NARRBEGIN: Home Care
Home Care
Data are collected on the number of house calls (x) made in a given week by each of 60 nurses in a certain hospital. The same data set is displayed in each of the three histograms below. NARREND
-{Home Care Narrative} Which histogram makes the differences in the house calls appear to be the most dramatic?
(Essay)
4.8/5 (28)
The median of a set of data is more representative than the mean when the mean is larger than most of the observations.
(True/False)
4.9/5 (24)
NARRBEGIN: Yearly Donations
Yearly Donations
The following data represent the yearly donations (in thousands of dollars) of a sample of 13 benefactors: 26.5, 23.5, 29.7, 24.8, 21.1, 24.3, 20.4, 22.7, 27.2, 23.7, 24.1, 24.8, and 28.2.NARREND
-{Yearly Donations Narrative} Compute and interpret the 90th percentile.
(Essay)
4.8/5 (43)
Filters
- Essay(0)
- Multiple Choice(0)
- Short Answer(0)
- True False(0)
- Matching(0)