Exam 4: Numerical Descriptive Techniques
Exam 1: What Is Statistics43 Questions
Exam 2: Graphical Descriptive Techniques I93 Questions
Exam 3: Graphical Descriptive Techniques II140 Questions
Exam 4: Numerical Descriptive Techniques316 Questions
Exam 5: Data Collection and Sampling82 Questions
Exam 6: Probability237 Questions
Exam 7: Random Variables and Discrete Probability Distributions277 Questions
Exam 8: Continuous Probability Distributions215 Questions
Exam 9: Sampling Distributions154 Questions
Exam 10: Introduction to Estimation152 Questions
Exam 11: Introduction to Hypothesis Testing187 Questions
Exam 12: Inference About a Population149 Questions
Exam 13: Inference About Comparing Two Populations168 Questions
Exam 14: Analysis of Variance157 Questions
Exam 15: Chi-Squared Tests Optional175 Questions
Exam 16: Simple Linear Regression and Correlation301 Questions
Exam 17: Multiple Regression158 Questions
Select questions type
The ____________________ is calculated by finding the middle of the data set, when the data are ordered from smallest to largest.
(Short Answer)
4.8/5  (33)
(33)
The shape of a distribution helps answer which question about the data?
(Multiple Choice)
4.9/5 (23)
Which of the following is correct about the shape of a distribution?
(Multiple Choice)
4.9/5 (42)
NARRBEGIN: Pets Survey
Pets Survey
A sample of 40 families were asked how many pets they owned. Their responses are summarized in the following table. Number of Pets 0 1 2 3 4 5 Number of Families 3 20 5 4 2 2 NARREND
-{Pets Survey Narrative} Determine the mean, the median, and the mode of the number of pets owned per family.
(Essay)
5.0/5 (41)
NARRBEGIN: Weights of Workers
Weights of Workers
The following data represent the number of employees of a sample of 25 companies: 164, 148, 137, 157, 173, 156, 177, 172, 169, 165, 145, 168, 163, 162, 174, 152, 156, 168, 154, 151, 174, 146, 134, 140, and 171.NARREND
-{Weights of Workers Narrative} Is the distribution of the number of workers symmetric or skewed? Why?
(Essay)
4.8/5 (31)
A perfect straight line sloping downward would produce a correlation coefficient equal to:
(Multiple Choice)
4.9/5 (36)
The following data represent the number of children in a sample of 10 families from a certain community: 4, 2, 1, 1, 5, 3, 0, 1, 0, and 2.
a.Compute the range.
b.Compute the variance.
c.Compute the standard deviation.
d.Compute the coefficient of variation.
e.Explain why in this case range > variance > standard deviation > coefficient of variation.
(Essay)
4.8/5 (34)
If the coefficient of correlation r = 0, there can be no relationship whatsoever between the dependent variable y and the independent variable x.
(True/False)
4.9/5 (33)
Differences in the frequencies of a histogram appear to be more dramatic if you ____________________ the vertical axis.
(Short Answer)
4.7/5 (45)
The following graph shows pepper prices throughout a 12-month period. 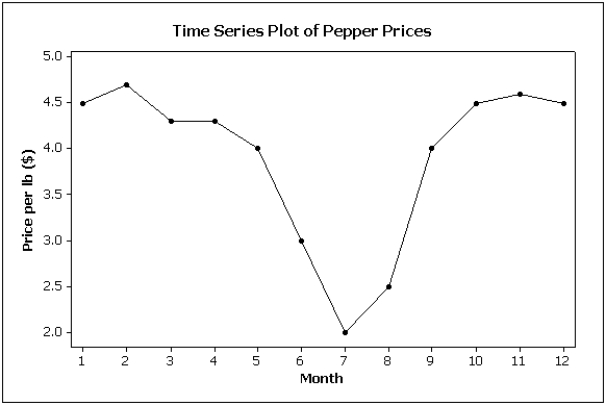 Suppose you made a new graph of the same data, where the maximum value on the Y-axis was changed from 5.0 to 10.0. (Assume everything else stays the same.) Your new graph would appear to have ____ variability in pepper prices compared to the original graph shown above.
(Multiple Choice)
4.9/5 (34)
NARRBEGIN: Weights of Police Officer
Weights of Police Officers
The following data represent the weights in pounds of a sample of 25 police officers: 164, 148, 137, 157, 173, 156, 177, 172, 169, 165, 145, 168, 163, 162, 174, 152, 156, 168, 154, 151, 174, 146, 134, 140, and 171.NARREND
-{Weights of Police Officers Narrative} Determine the location and value of the lower quartile of the weights.
(Essay)
4.7/5 (34)
The magnitude of the correlation measures the ____________________ of a linear relationship.
(Short Answer)
4.8/5 (30)
Differences in the frequencies of a histogram appear to be less dramatic if you ____________________ the vertical axis.
(Short Answer)
4.9/5 (34)
Which of the following characteristics does a histogram help you identify?
(Multiple Choice)
4.9/5 (36)
The first and second quartiles of a data set can never be equal.
(True/False)
4.8/5 (39)
A box plot is a graphical representation of the 5-number summary.
(True/False)
4.7/5 (37)
In a negatively skewed distribution, which of the following is the correct statement?
(Multiple Choice)
4.8/5 (42)
The line drawn within the box of a box plot always represents the median.
(True/False)
4.8/5 (24)
Filters
- Essay(0)
- Multiple Choice(0)
- Short Answer(0)
- True False(0)
- Matching(0)