Exam 4: Numerical Descriptive Techniques
Exam 1: What Is Statistics43 Questions
Exam 2: Graphical Descriptive Techniques I93 Questions
Exam 3: Graphical Descriptive Techniques II140 Questions
Exam 4: Numerical Descriptive Techniques316 Questions
Exam 5: Data Collection and Sampling82 Questions
Exam 6: Probability237 Questions
Exam 7: Random Variables and Discrete Probability Distributions277 Questions
Exam 8: Continuous Probability Distributions215 Questions
Exam 9: Sampling Distributions154 Questions
Exam 10: Introduction to Estimation152 Questions
Exam 11: Introduction to Hypothesis Testing187 Questions
Exam 12: Inference About a Population149 Questions
Exam 13: Inference About Comparing Two Populations168 Questions
Exam 14: Analysis of Variance157 Questions
Exam 15: Chi-Squared Tests Optional175 Questions
Exam 16: Simple Linear Regression and Correlation301 Questions
Exam 17: Multiple Regression158 Questions
Select questions type
NARRBEGIN: Experience and Salary
Longevity and Salary
A sample of eight observations of variables x (years of experience) and y (salary in $1,000s) is shown below:
5 3 7 9 2 4 6 y 20 23 15 11 27 21 17 14 NARREND
-{Longevity and Salary Narrative}
a.Calculate the coefficient of correlation, and comment on the relationship between x and y.
b.Give a possible reason that the correlation is negative.
(Essay)
4.9/5  (38)
(38)
Which of the following is a characteristic of graphical excellence?
(Multiple Choice)
4.9/5 (30)
Which of the following types of data has no measure of variability?
(Multiple Choice)
4.8/5 (31)
Suppose that a firm's sales were $3,750,000 five years ago and are $5,250,000 today. What was the geometric mean growth rate in sales over the past five years?
(Essay)
4.8/5 (31)
NARRBEGIN: Hours of Playing Video Ga
Hours of Playing Video Games
Suppose that the following data provide the hours of playing video games per week for a sample of 15 high school students in Roanoke, Virginia: 5, 11, 25, 19, 18, 20, 27, 13, 8, 10, 15, 19, 18, 9, and 12.NARREND
-{Hours of Playing Video Games Narrative} Determine the location and value of the third quartile.
(Essay)
4.8/5 (29)
NARRBEGIN: Admission to ER
Admission to ER
The following bar chart shows the type of aspirin (if any) given to 100 cardiac patients within 15 minutes of their admission to the emergency room. 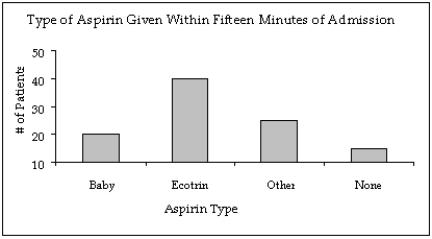 NARREND
-{Admission to ER Narrative} Notice that the Y-axis of the bar chart does not start at a frequency of zero. Create a new bar chart of the displayed data that accurately displays the frequency for each aspirin type.
NARREND
-{Admission to ER Narrative} Notice that the Y-axis of the bar chart does not start at a frequency of zero. Create a new bar chart of the displayed data that accurately displays the frequency for each aspirin type.
(Essay)
4.8/5 (38)
NARRBEGIN: Salaries of Employees
Salaries of Employees
The following data represent the yearly salaries (in thousands of dollars) of a sample of 13 employees of a firm: 26.5, 23.5, 29.7, 24.8, 21.1, 24.3, 20.4, 22.7, 27.2, 23.7, 24.1, 24.8, and 28.2.NARREND
-{Salaries of Employees Narrative} Compute the mean salary.
(Essay)
4.8/5 (46)
There are three measures of central location; the mean, the ____________________ and the ____________________.
(Short Answer)
4.8/5 (38)
A pie chart showing 80% yes and 20% no would look the same whether it was based on 10,000 observations or 10 observations. This is one way that pie charts can be deceptive.
(True/False)
4.8/5 (30)
NARRBEGIN: Milk Demand
Milk Demand
A supermarket has determined that daily demand for milk containers has an approximate bell shaped distribution, with a mean of 55 containers and a standard deviation of six containers.NARREND
-{Milk Demand Narrative} How often can we expect between 49 and 61 containers to be sold in a day? (Give a percentage.)
(Short Answer)
4.9/5 (26)
NARRBEGIN: Admission to ER
Admission to ER
The following bar chart shows the type of aspirin (if any) given to 100 cardiac patients within 15 minutes of their admission to the emergency room. NARREND
-{Admission to ER Narrative} In what way does the original bar chart distort the data as compared to a bar chart that starts at zero on the Y-axis (frequency axis)?
(Essay)
4.8/5 (31)
If the median, median and mode are all equal, the histogram must be symmetric and bell shaped.
(True/False)
4.9/5 (39)
The precision provided by the numerical techniques (mean, median, and standard deviation) provides more useful information than graphical techniques (histograms and box plots) alone.
(True/False)
4.9/5 (42)
Pie charts only show ____________________, not ____________________. This means you don't know what the sample size is unless it is stated on the pie chart.
(Essay)
4.7/5 (24)
The ____________________ of a linear relationship is hard to interpret from the covariance, but it is easy to interpret from the correlation.
(Short Answer)
4.8/5 (32)
In a bell shaped distribution, there is no difference in the values of the mean, median, and mode.
(True/False)
4.8/5 (38)
The middle line inside the box in a box plot represents the ____________________.
(Short Answer)
4.8/5 (43)
NARRBEGIN: Children
Computers
The following data represent the number of computers owned by a sample of 10 families from Chicago: 4, 2, 1, 1, 5, 3, 0, 1, 0, and 2.NARREND
-{Computers Narrative} Compute the median number of computers.
(Short Answer)
4.8/5 (35)
Filters
- Essay(0)
- Multiple Choice(0)
- Short Answer(0)
- True False(0)
- Matching(0)