Exam 4: Numerical Descriptive Techniques
Exam 1: What Is Statistics43 Questions
Exam 2: Graphical Descriptive Techniques I93 Questions
Exam 3: Graphical Descriptive Techniques II140 Questions
Exam 4: Numerical Descriptive Techniques316 Questions
Exam 5: Data Collection and Sampling82 Questions
Exam 6: Probability237 Questions
Exam 7: Random Variables and Discrete Probability Distributions277 Questions
Exam 8: Continuous Probability Distributions215 Questions
Exam 9: Sampling Distributions154 Questions
Exam 10: Introduction to Estimation152 Questions
Exam 11: Introduction to Hypothesis Testing187 Questions
Exam 12: Inference About a Population149 Questions
Exam 13: Inference About Comparing Two Populations168 Questions
Exam 14: Analysis of Variance157 Questions
Exam 15: Chi-Squared Tests Optional175 Questions
Exam 16: Simple Linear Regression and Correlation301 Questions
Exam 17: Multiple Regression158 Questions
Select questions type
The mean of fifty sales receipts is $65.75 and the standard deviation is $10.55. Using Chebysheff's Theorem, 75% of the sales receipts were between $44.65 and $86.85.
(True/False)
4.8/5  (27)
(27)
In its 2000 report, a company presented the following data regarding its sales (in millions of dollars), and net income (in millions of dollars). Year 1996 1997 1998 1999 2000 Sales 70 97 80 55 185 Net Income 1.6 5.2 4.1 2.4 7.1 The bar chart below was used to present these data. 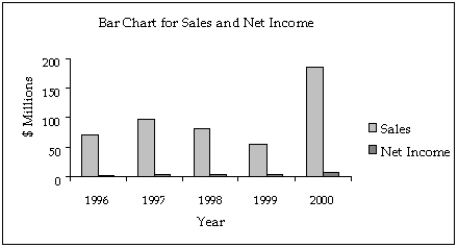 Assume that you are an unscrupulous statistician and want to make the data appear more positive than they really are. Redraw the graph by being selective about which years to include, getting the desired effect.
(Essay)
4.8/5 (39)
NARRBEGIN: Ages of Workers
Ages of Workers
The ages (in years) of three groups of workers are shown below:
GROUP A: 17 22 20 18 23 GROUP B: 30 28 35 40 25 GROUP C: 44 39 54 21 52 NARREND
-The number of hours a college student spent studying during the final exam week was recorded as follows: 6, 5, 2, 8, 7, 4, and 9. Compute the range for the data, express the number in the appropriate unit.
(Short Answer)
4.7/5 (31)
NARRBEGIN: Strip Mall Rent
Strip Mall Rent
Monthly rent data in dollars for a sample of 10 stores in a small town in South Dakota are as follows: 220, 216, 220, 205, 210, 240, 195, 235, 204, and 250.NARREND
-{Strip Mall Rent Narrative} What is the mode?
(Short Answer)
4.9/5 (38)
Box plots and medians work well to describe ____________________ data, while histograms and means work well to describe ____________________ data.
(Short Answer)
4.8/5 (34)
Slopes and trends in a line chart appear to be less steep if you ____________________ the horizontal (time) axis.
(Short Answer)
4.9/5 (28)
When the standard deviation is expressed as a percentage of the mean, the result is the coefficient of correlation.
(True/False)
4.9/5 (32)
Any points that lie outside the whiskers on a box plot are called ____________________.
(Short Answer)
4.9/5 (40)
A statistic that interprets the standard deviation relative to the size of the numbers in the data set is called the ____________________ of ____________________.
(Short Answer)
4.9/5 (24)
If the first and second quartiles are farther apart than the second and third quartiles, the shape of the histogram based on the quartiles is ____________________.
(Short Answer)
4.8/5 (40)
NARRBEGIN: Ages of Retirees
Ages of Retirees
A sociologist recently conducted a survey of retirees over 65 years of age whose net worth is too high to qualify for Medicaid and who have no private health insurance. The ages of 20 uninsured retirees were as follows: 65, 66, 67, 68, 69, 70, 71, 73, 74, 75, 78, 79, 80, 81, 86, 87, 91, 92, 94, and 97.NARREND
-{Ages of Retirees Narrative} Calculate the third quartile of the ages of the uninsured retirees.
(Essay)
4.9/5 (35)
The data set 10, 20, 30 has the same variance as the data set 100, 200, 300.
(True/False)
4.8/5 (33)
NARRBEGIN: Ages of Jockeys
Ages of Jockeys
The following data represent the ages in years of a sample of 25 jockeys from a local race track: 31, 43, 56, 23, 49, 42, 33, 61, 44, 28, 48, 38, 44, 35, 40, 64, 52, 42, 47, 39, 53, 27, 36, 35, and 20.NARREND
-{Ages of Jockeys Narrative} Find the upper quartile of the ages.
(Essay)
4.9/5 (40)
In a histogram, the proportion of the total area which must be to the left of the median is more than 0.50 if the distribution is positively skewed.
(True/False)
4.8/5 (39)
Which of the following measures of variability is not sensitive to extreme values?
(Multiple Choice)
4.9/5 (33)
NARRBEGIN: Weights of Teachers
Weights of Teachers
The following data represent the weights in pounds of a sample of 25 teachers: 164, 148, 137, 157, 173, 156, 177, 172, 169, 165, 145, 168, 163, 162, 174, 152, 156, 168, 154, 151, 174, 146, 134, 140, and 171.NARREND
-{Weights of Teachers Narrative} Which is a better measure of variability in the weights of the workers, the standard deviation or the coefficient of variation?
(Essay)
4.8/5 (31)
NARRBEGIN: Ages of Jockeys
Ages of Jockeys
The following data represent the ages in years of a sample of 25 jockeys from a local race track: 31, 43, 56, 23, 49, 42, 33, 61, 44, 28, 48, 38, 44, 35, 40, 64, 52, 42, 47, 39, 53, 27, 36, 35, and 20.NARREND
-{Ages of Jockeys Narrative} Construct a relative frequency distribution for the data, using five class intervals and the value 20 as the lower limit of the first class.
(Essay)
4.9/5 (35)
In a positively skewed distribution, the percentage of data between the smallest observation and Q1 is less than the percentage of data between Q3 and the largest observation.
(True/False)
4.8/5 (49)
The value of the standard deviation may be either positive or negative, while the value of the variance will always be positive.
(True/False)
4.8/5 (28)
Filters
- Essay(0)
- Multiple Choice(0)
- Short Answer(0)
- True False(0)
- Matching(0)