Exam 4: Numerical Descriptive Techniques
Exam 1: What Is Statistics43 Questions
Exam 2: Graphical Descriptive Techniques I93 Questions
Exam 3: Graphical Descriptive Techniques II140 Questions
Exam 4: Numerical Descriptive Techniques316 Questions
Exam 5: Data Collection and Sampling82 Questions
Exam 6: Probability237 Questions
Exam 7: Random Variables and Discrete Probability Distributions277 Questions
Exam 8: Continuous Probability Distributions215 Questions
Exam 9: Sampling Distributions154 Questions
Exam 10: Introduction to Estimation152 Questions
Exam 11: Introduction to Hypothesis Testing187 Questions
Exam 12: Inference About a Population149 Questions
Exam 13: Inference About Comparing Two Populations168 Questions
Exam 14: Analysis of Variance157 Questions
Exam 15: Chi-Squared Tests Optional175 Questions
Exam 16: Simple Linear Regression and Correlation301 Questions
Exam 17: Multiple Regression158 Questions
Select questions type
NARRBEGIN: Salaries of Office Worker
Salaries of Office Workers
The following data represent the salaries (in thousands of dollars) of a sample of 13 office workers of a firm: 26.5, 23.5, 29.7, 24.8, 21.1, 24.3, 20.4, 22.7, 27.2, 23.7, 24.1, 24.8, and 28.2.NARREND
-{Salaries of Office Workers Narrative} Compute the variance, and standard deviation of the salaries, and express the numbers in the appropriate units.
(Essay)
4.8/5  (34)
(34)
The length of the box in a box plot portrays the interquartile range.
(True/False)
4.9/5 (28)
NARRBEGIN: Ages of Jockeys
Ages of Jockeys
The following data represent the ages in years of a sample of 25 jockeys from a local race track: 31, 43, 56, 23, 49, 42, 33, 61, 44, 28, 48, 38, 44, 35, 40, 64, 52, 42, 47, 39, 53, 27, 36, 35, and 20.NARREND
-{Ages of Jockeys Narrative} Find the lower quartile of the ages.
(Essay)
4.8/5 (36)
The variance is more meaningful and easier to interpret compared to the standard deviation.
(True/False)
4.8/5 (25)
NARRBEGIN: Hours Worked per Week
Hours Worked per Week
The following data represent the hours worked per week of a sample of 25 employees from a government department: 31, 43, 56, 23, 49, 42, 33, 61, 44, 28, 48, 38, 44, 35, 40, 64, 52, 42, 47, 39, 53, 27, 36, 35, and 20.NARREND
-{Hours Worked per Week Narrative} Construct a stem and leaf display for the hours.
(Essay)
5.0/5 (35)
The coefficient of correlation r is a number that indicates the direction and the strength of the linear relationship between the dependent variable y and the independent variable x.
(True/False)
4.8/5 (33)
NARRBEGIN: Home Care
Home Care
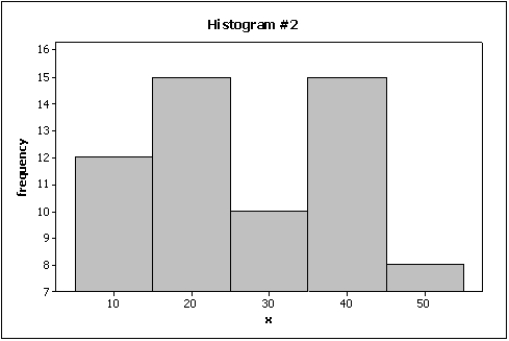
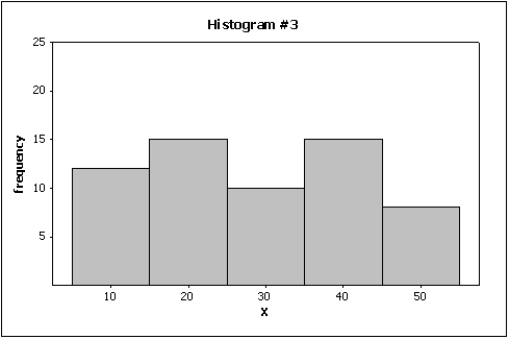
Data are collected on the number of house calls (x) made in a given week by each of 60 nurses in a certain hospital. The same data set is displayed in each of the three histograms below. 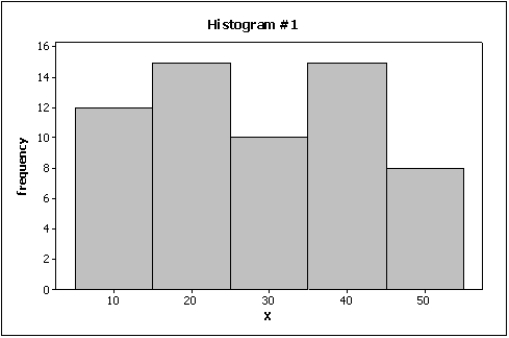
 NARREND
-{Home Care Narrative} How many nurses are there in this hospital?
NARREND
-{Home Care Narrative} How many nurses are there in this hospital?
(Essay)
4.9/5 (41)
NARRBEGIN: Ages of Workers
Ages of Workers
The ages (in years) of three groups of workers are shown below:
GROUP A: 17 22 20 18 23 GROUP B: 30 28 35 40 25 GROUP C: 44 39 54 21 52 NARREND
-{Ages of Workers Narrative} Compute and compare the ranges for the three groups.
(Essay)
4.8/5 (26)
The advantage that the coefficient of correlation has over the covariance is that the former has set lower and upper limits.
(True/False)
4.8/5 (33)
Graphical techniques should not be used to present data if accurate tabular forms for the same data are available.
(True/False)
4.9/5 (41)
The Empirical Rule states that the percentage of observations in a data set (providing that the data set is bell shaped) that fall within one standard deviation of their mean is approximately 75%.
(True/False)
4.9/5 (35)
Which of the following statements illustrates graphical deception?
(Multiple Choice)
4.7/5 (33)
The horizontal lines extending to the left and to the right of the box in a box plot are called ____________________.
(Short Answer)
4.8/5 (29)
Generally speaking, if two variables are unrelated, the covariance will be a number close to zero.
(True/False)
4.9/5 (30)
NARRBEGIN: Ages of Jockeys
Ages of Jockeys
The following data represent the ages in years of a sample of 25 jockeys from a local race track: 31, 43, 56, 23, 49, 42, 33, 61, 44, 28, 48, 38, 44, 35, 40, 64, 52, 42, 47, 39, 53, 27, 36, 35, and 20.NARREND
-{Ages of Jockeys Narrative}
a.Construct a box plot for the ages and identify any extreme values.
b.What does the box plot tell you about the distribution of the data?
(Essay)
4.8/5 (39)
NARRBEGIN: Ages of Volunteers
Ages of Volunteers
The following data represent the ages in years of a sample of 25 volunteers from a charitable organization: 31, 43, 56, 23, 49, 42, 33, 61, 44, 28, 48, 38, 44, 35, 40, 64, 52, 42, 47, 39, 53, 27, 36, 35, and 20.NARREND
-{Ages of Volunteers Narrative} Compute the range of the data, and express the number in the appropriate unit.
(Short Answer)
4.9/5 (29)
NARRBEGIN: Salaries of Employees
Salaries of Employees
The following data represent the yearly salaries (in thousands of dollars) of a sample of 13 employees of a firm: 26.5, 23.5, 29.7, 24.8, 21.1, 24.3, 20.4, 22.7, 27.2, 23.7, 24.1, 24.8, and 28.2.NARREND
-A mutual fund you purchased in the years 2011-2014 has the following rates of return shown below:
Year 2011 2012 2013 2014 Rate of Return .50 .30 -.10 -.15 Compute the geometric mean.
(Essay)
4.8/5 (42)
NARRBEGIN: Ages of Workers
Ages of Workers
The ages (in years) of three groups of workers are shown below:
GROUP A: 17 22 20 18 23 GROUP B: 30 28 35 40 25 GROUP C: 44 39 54 21 52 NARREND
-Suppose your data set contains ages (in years) and you calculate the range, variance, standard deviation, and coefficient of variation for the data. Explain what units each of these measures is in.
(Essay)
4.7/5 (41)
Filters
- Essay(0)
- Multiple Choice(0)
- Short Answer(0)
- True False(0)
- Matching(0)