Exam 2: Linear Equations and Functions
Exam 1: Algebraic Concepts308 Questions
Exam 2: Linear Equations and Functions243 Questions
Exam 3: Quadratic and Other Special Functions113 Questions
Exam 4: Matrices227 Questions
Exam 5: Inequalities and Linear Programming120 Questions
Exam 6: Exponential and Logarithmic Functions108 Questions
Exam 7: Mathematics of Finance131 Questions
Exam 8: Introduction to Probability178 Questions
Exam 9: Further Topics in Probability; Data Description114 Questions
Exam 10: Derivatives248 Questions
Exam 11: Applications of Derivatives172 Questions
Exam 12: Derivatives Continued139 Questions
Exam 13: Indefinite Integrals120 Questions
Exam 14: Definite Integrals: Techniques of Integration185 Questions
Exam 15: Functions of Two or More Variables119 Questions
Select questions type
According to the U.S. Bureau of the Census, the relation between the average annual earnings of males and females with various levels of educational attainment can be modeled by the function 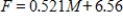 where M and F represent the average annual earnings (in thousands of dollars) of males and females, respectively. When the average annual earnings for males reach $45,000, what does the equation predict for the average annual earnings for females? Round your answer to the nearest dollar.
(Multiple Choice)
4.9/5  (34)
(34)
If t represents the number of hours after 9:30 A.M. on Tuesday, October 5, 2004, then the graph defines the Dow Jones Industrial Average D as a function of time t. If we represent this function by  use the graph to find f(6.5).
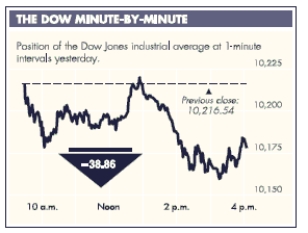
Source: Bloomberg Financial Markets, The New York Times, October 6, 2004. Copyright © 2004 The New York Times Co. Reprinted by permission.
Source: Bloomberg Financial Markets, The New York Times, October 6, 2004. Copyright © 2004 The New York Times Co. Reprinted by permission.
(Multiple Choice)
4.9/5 (32)
Suppose the cost C of removing p percent of the particulate pollution from the exhaust gases at an industrial site is given by  . Because p is the percent particulate pollution, we know
  . Use the restriction on p and experiment with a C-range to obtain an accurate graph of the equation. Determine the p-intercept and explain its meaning.
(Multiple Choice)
5.0/5 (36)
A linear revenue function is  , where x represents the number of units sold. What is the revenue received from selling one more item if 75 are currently being sold? Round your answer to the nearest cent.
(Multiple Choice)
5.0/5 (34)
Write the equation of the line passing through the given pair of points.
(3,9) and (11,1)
(Multiple Choice)
4.8/5 (37)
Use the x-intercept method to find the solution to this equation. 
(Multiple Choice)
4.9/5 (43)
Each ounce of substance A supplies 4% of the nutrition a patient needs. Substance B supplies 29% of the required nutrition per ounce, and substance C supplies 14% of the required nutrition per ounce. If digestive restrictions require that substances A and C be given in equal amounts, and the amount of substance B be one-fifth of either of these other amounts, find the number of ounces of each substance that should be in the meal to provide 100% of the required nutrition.
(Multiple Choice)
4.8/5 (40)
Suppose a computer manufacturer has the total cost function 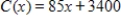 and the total revenue function
  , where x represents the number of computers produced and sold. What is the profit on 351 items?
(Multiple Choice)
4.8/5 (36)
What is the rate of change of the function whose graph is a line passing through  and
and  ?
?
(Multiple Choice)
4.9/5 (39)
Solve the system by elimination, or by any convenient method. 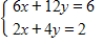
(Multiple Choice)
5.0/5 (27)
Suppose that in a certain market, the demand function for a product is given by 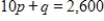 and the supply function is given by
  , where p is the price per unit in dollars and q is the quantity produced. If the government levies a tax of $9 per item on the supplier, who passes the tax on to the consumer as a price increase, find the equilibrium price and quantity after the tax is levied. Round q to the nearest whole number and round p to one decimal place.
(Multiple Choice)
4.9/5 (42)
Use a graphing utility with the standard viewing window  and
and  to graph the function. Choose the correct graph below.
(Multiple Choice)
4.8/5 (34)
Solve the inequality and choose the graph of the solution. 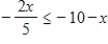
(Multiple Choice)
4.8/5 (32)
Suppose that the total cost function for a radio is linear, that the marginal cost is $27, and that the total cost for 50 radios is $5,250. Write the equation of this cost function  .
.
(Multiple Choice)
4.9/5 (37)
The equation in this problem leads to a linear equation. Solve for x. Because the solution to the linear equation may not be a solution to the original equation, be sure to check the solution in the original equation. 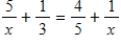
(Multiple Choice)
4.8/5 (29)
Filters
- Essay(0)
- Multiple Choice(0)
- Short Answer(0)
- True False(0)
- Matching(0)