Exam 2: Linear Equations and Functions
Exam 1: Algebraic Concepts308 Questions
Exam 2: Linear Equations and Functions243 Questions
Exam 3: Quadratic and Other Special Functions113 Questions
Exam 4: Matrices227 Questions
Exam 5: Inequalities and Linear Programming120 Questions
Exam 6: Exponential and Logarithmic Functions108 Questions
Exam 7: Mathematics of Finance131 Questions
Exam 8: Introduction to Probability178 Questions
Exam 9: Further Topics in Probability; Data Description114 Questions
Exam 10: Derivatives248 Questions
Exam 11: Applications of Derivatives172 Questions
Exam 12: Derivatives Continued139 Questions
Exam 13: Indefinite Integrals120 Questions
Exam 14: Definite Integrals: Techniques of Integration185 Questions
Exam 15: Functions of Two or More Variables119 Questions
Select questions type
Solve the system by elimination, or by any convenient method. 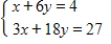
(Multiple Choice)
4.8/5  (39)
(39)
The figure below is the graph of both the demand function D and the supply function S for the same product, where P is the price per unit and Q is the number of units produced. Will there be a market surplus or shortage when the price P is $250? 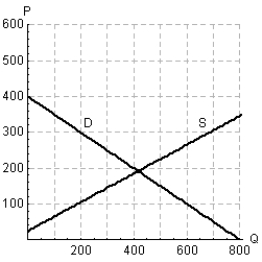
(Multiple Choice)
4.9/5 (30)
Suppose a mining company will supply 80,000 tons of ore per month if the price is $25 per ton but will supply only 60,000 tons per month if the price is $20 per ton. Assume the demand function is linear. Choose the correct equation for demand in the form p for price in terms of q for quantity. Round your coefficients to five decimal places.
(Multiple Choice)
4.9/5 (35)
For the given graph, determine whether the line has a slope that is positive, negative, zero, or undefined. 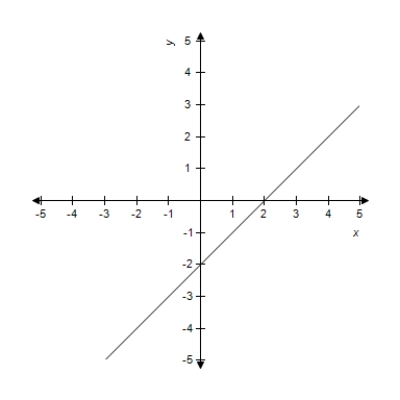
(Multiple Choice)
4.9/5 (37)
Determine whether the following pairs of equations represent parallel lines, perpendicular lines, or neither of these. 

(Multiple Choice)
4.8/5 (43)
When a debt is refinanced, sometimes the term of the loan (that is, the time it takes to repay the debt) is shortened. Suppose the current interest rate is 7%, and the current debt is $100,000. The monthly payment R of the refinanced debt is a function of the term of the loan t in years. If we represent this function by  , then the following table defines the function.
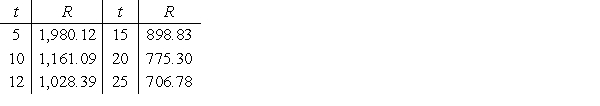
Source: Comprehensive Mortgage Payment Tables, Publication No. 492, Financial Publishing Co., Boston
Choose the correct verbal description of
Source: Comprehensive Mortgage Payment Tables, Publication No. 492, Financial Publishing Co., Boston
Choose the correct verbal description of  .
.
(Multiple Choice)
5.0/5 (36)
Solve the system by elimination, or by any convenient method. 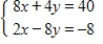
(Multiple Choice)
4.9/5 (36)
Find the slope of the line passing through the given pair of points.  and
and 
(Multiple Choice)
4.8/5 (36)
Find the slope of the line passing through the given pair of points.  and
and 
(Multiple Choice)
4.8/5 (28)
Choose the equation of the line with the given slope and y-intercept.
Slope: 5 y-intercept: 3
(Multiple Choice)
4.8/5 (31)
Graph the equation with a standard window  and
and  on a graphing utility. Does the graph appear to be a linear function?
(Multiple Choice)
4.9/5 (39)
Suppose that the cost C (in dollars) of removing p percent of the particulate pollution from the smokestacks of an industrial plant is given by 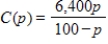 . Find the domain of this function. Recall that p represents the percent pollution that is removed.
(Multiple Choice)
4.9/5 (38)
Use a graphing utility with the specified range to graph the equation. Is the graph below the graph of the given equation? 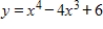

(Multiple Choice)
4.7/5 (39)
Find the slope m and y-intercept b of the line whose equation is given below.
Y = 5
(Multiple Choice)
4.9/5 (36)
Thrifty rents a compact car for $35 per day, and Budget rents a similar car for $20 per day plus an initial fee of $120. Which of the following graphs depicts the number of days for which it would be cheaper to rent from Budget?
(Multiple Choice)
4.8/5 (37)
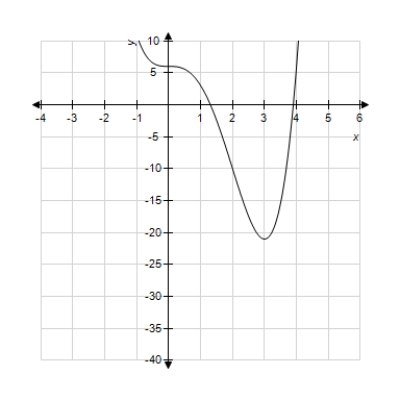
The graph of  is shown in the figure below.
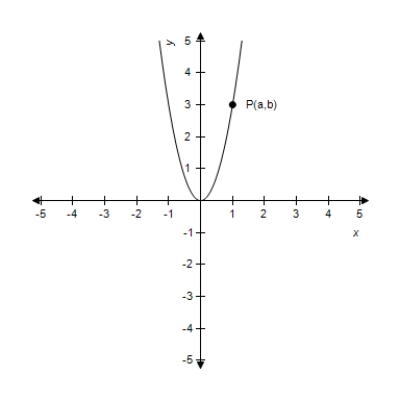
If the point P (with coordinates (a, b)) is on the graph, how are a and b related?
If the point P (with coordinates (a, b)) is on the graph, how are a and b related?
(Multiple Choice)
4.8/5 (32)
In the United States between 1970 and 2002, the number (in millions) of black children B(x) and Hispanic children H(x) can be described by 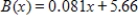 and
and 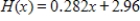 , where x is the number of years after December 31st, 1970. In what year were the numbers of children equal?
(Multiple Choice)
4.8/5 (28)
Graph the equation with a graphing utility; use a window that includes the intercepts. Which range shows both the intercepts? 
(Multiple Choice)
4.9/5 (41)
According to the U.S. Bureau of the Census, the relation between the average annual earnings of males and females with various levels of educational attainment can be modeled by the function F = 0.521M + 6.368 , where M and F represent the average annual earnings (in thousands of dollars) of males and females, respectively. Choose the correct interpretation of the slope.
(Multiple Choice)
4.8/5 (24)
Filters
- Essay(0)
- Multiple Choice(0)
- Short Answer(0)
- True False(0)
- Matching(0)