Exam 2: Linear Equations and Functions
Exam 1: Algebraic Concepts308 Questions
Exam 2: Linear Equations and Functions243 Questions
Exam 3: Quadratic and Other Special Functions113 Questions
Exam 4: Matrices227 Questions
Exam 5: Inequalities and Linear Programming120 Questions
Exam 6: Exponential and Logarithmic Functions108 Questions
Exam 7: Mathematics of Finance131 Questions
Exam 8: Introduction to Probability178 Questions
Exam 9: Further Topics in Probability; Data Description114 Questions
Exam 10: Derivatives248 Questions
Exam 11: Applications of Derivatives172 Questions
Exam 12: Derivatives Continued139 Questions
Exam 13: Indefinite Integrals120 Questions
Exam 14: Definite Integrals: Techniques of Integration185 Questions
Exam 15: Functions of Two or More Variables119 Questions
Select questions type
Suppose the percent of U.S. high school seniors from 1975 to 2001 who used marijuana can be modeled by 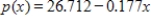 percent, where x is the number of years past 1975. Choose the correct interpretation the slope in this equation as a rate of change.
(Multiple Choice)
4.9/5  (36)
(36)
The percent P of men 65 years of age or older in the labor force can be modeled by 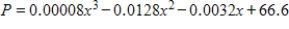 , where x is the number of years past 1890 (Source: U.S. Bureau of the Census). Plot this function using a graphing utility. What range of x-values and y-values do you need to use to view this graph for the years 1890 to 2010?
(Multiple Choice)
4.8/5 (33)
Use the left-to-right elimination method to solve the system. 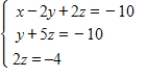
(Multiple Choice)
4.8/5 (33)
Choose the correct graph of the line with the given slope and y-intercept.
Slope:  y-intercept:
(Multiple Choice)
4.8/5 (24)
Which of the graphs below represent y as a function of x?
(a)
 (b)
(b)
(Multiple Choice)
4.9/5 (31)
Medication A is given every 4 hours and medication B is given twice each day. The total intake of the two medications is restricted to 54.9 mg per day, for a certain patient. If the ratio of the dosage of A to the dosage of B is 1 to 5, find the dosage for each administration of each medication.
(Multiple Choice)
4.8/5 (34)
A retired woman has $130,000 to invest. She has chosen one relatively safe investment fund that has an annual yield of 9% and another, riskier one that has an annual yield of 13%. How much should she invest in the fund yielding 9% if she would like to earn $14,000 per year from her investments?
(Multiple Choice)
4.9/5 (38)
Write the equation and graph the line that passes through the given point and has the slope indicated.
(-2,-2) with 0 slope
(Multiple Choice)
4.8/5 (28)
Graph the function below and experiment with the viewing window to obtain a complete graph, adjusting the ranges where necessary. Does the figure below show the complete graph? 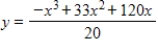
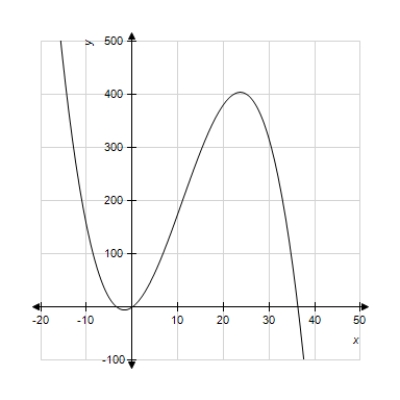
(Multiple Choice)
4.8/5 (34)
Use a graphing utility with the standard viewing window  and
and  to graph the function. Choose the correct graph below.
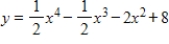
(Multiple Choice)
4.9/5 (33)
The retirement plan for Pennsylvania state employees is based on the following formula: "2.5% of average final compensation multiplied by years of credited service" (Source: Pennsylvania State Employees Retirement System, 2001). Let p represent annual retirement pension and y denote the years of service. For someone with average final compensation of $85,000, write the linear equation that gives p in terms of y.
(Multiple Choice)
4.9/5 (42)
A company handles an apartment building with 50 units. Experience has shown that if the rent for each of the units is $370 per month, then all of the units will be filled; however, one unit will become vacant for each $10 increase in the monthly rate. If x represents the number of $10 increases, express the revenue R from the building as a function of x.
(Multiple Choice)
4.8/5 (40)
Filters
- Essay(0)
- Multiple Choice(0)
- Short Answer(0)
- True False(0)
- Matching(0)