Exam 2: Linear Equations and Functions
Exam 1: Algebraic Concepts308 Questions
Exam 2: Linear Equations and Functions243 Questions
Exam 3: Quadratic and Other Special Functions113 Questions
Exam 4: Matrices227 Questions
Exam 5: Inequalities and Linear Programming120 Questions
Exam 6: Exponential and Logarithmic Functions108 Questions
Exam 7: Mathematics of Finance131 Questions
Exam 8: Introduction to Probability178 Questions
Exam 9: Further Topics in Probability; Data Description114 Questions
Exam 10: Derivatives248 Questions
Exam 11: Applications of Derivatives172 Questions
Exam 12: Derivatives Continued139 Questions
Exam 13: Indefinite Integrals120 Questions
Exam 14: Definite Integrals: Techniques of Integration185 Questions
Exam 15: Functions of Two or More Variables119 Questions
Select questions type
Find the slope m and y-intercept b of the line whose equation is given below.
X = - 
(Multiple Choice)
4.8/5  (37)
(37)
Approximate the zeros of the function below by approximating the x-intercepts with a graphing utility. Round your answer to four decimal places 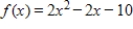
(Multiple Choice)
4.8/5 (31)
A nut wholesaler sells a mix of cashews and peanuts. He charges $2.80 per pound for cashews and $5.30 per pound for peanuts. If the mix is to sell for $3.3 per pound, how many pounds each of peanuts and cashews should be used to make 100 pounds of the mix?
(Multiple Choice)
4.9/5 (37)
Suppose that the consumer expenditure E (in dollars) depends on the market price p per unit (in dollars) according to 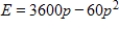 . Graph this equation with a graphing utility and the range
  Because E represents consumer expenditure, only values of
  have meaning. Determine the values of p for which
  .
.
(Multiple Choice)
4.8/5 (30)
The figure below show the demand and supply functions for a product. Decide which line shows the supply function and which line the demand function. 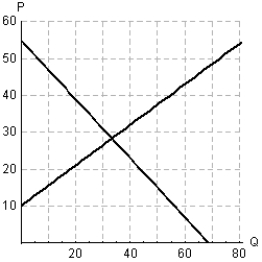
Will a price above the equilibrium price result in a market surplus or shortage?
Will a price above the equilibrium price result in a market surplus or shortage?
(Multiple Choice)
4.9/5 (40)
Solve the inequality and choose the graph of the solution. 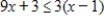
(Multiple Choice)
4.8/5 (26)
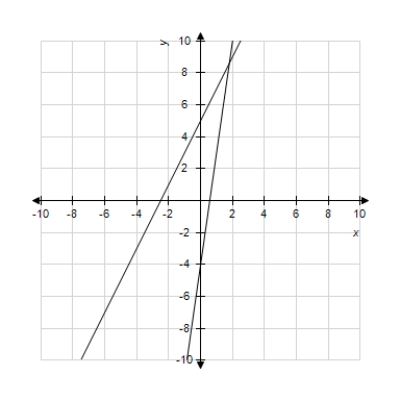
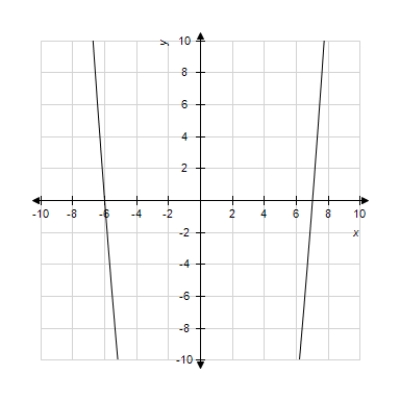
The graphs of the two equations below are shown. The lines representing these equations may be the same, may intersect once, or may be parallel. Decide whether the system of equations in the problem has one solution, no solution, or an infinite number of solutions.  and
and 
(Multiple Choice)
4.8/5 (31)
A linear cost function is 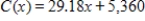 , where x represents the number of units produced. What is the cost of producing one more item if 150 are currently being produced? Round your answer to the nearest cent.
(Multiple Choice)
4.8/5 (37)
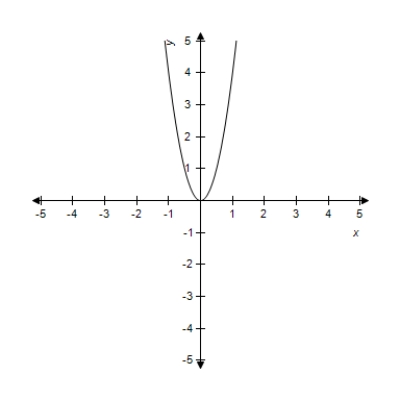
Which of the graphs below represent y as a function of x?
(a)
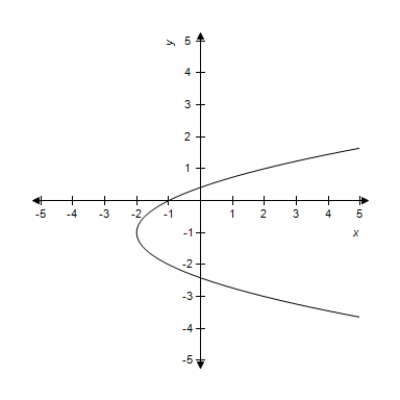 (b)
(b)
(Multiple Choice)
4.9/5 (30)
Suppose a calculator manufacturer has the total cost function 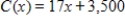 and the total revenue function
  , where x represents the number of calculators sold. What is the equation of the profit function,
  , for the calculator manufacturer?
(Multiple Choice)
4.9/5 (36)
Solve the system by elimination, or by any convenient method. 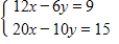
(Multiple Choice)
4.9/5 (40)
In a study using 50 foreign-language vocabulary words, the learning rate L (in words per minute) was found to depend on the number of words already learned x, according to the equation  . Use the intercepts to determine a window, and then use a graphing utility to graph the equation for
  Based on the graph, is the learning rate increasing or decreasing?
(Multiple Choice)
4.9/5 (31)
A bank lent $108,500 to a company for the development of two products. If the loan for product A was for $33,500 more than that for product B, how much was lent for each product?
(Multiple Choice)
4.8/5 (43)
Graph the function below and experiment with the viewing window to obtain a complete graph, adjusting the ranges where necessary. Does the figure below show the complete graph?

(Multiple Choice)
4.8/5 (42)
The graph of  is shown in the figure below.
Does the point (0,1) lie on the graph? In other words, do the coordinates satisfy the equation?
Does the point (0,1) lie on the graph? In other words, do the coordinates satisfy the equation?
(Multiple Choice)
4.8/5 (36)
Graph the function using a window that gives a complete graph. What does y approach as x gets large? 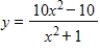
(Multiple Choice)
4.8/5 (35)
Filters
- Essay(0)
- Multiple Choice(0)
- Short Answer(0)
- True False(0)
- Matching(0)