Exam 2: Linear Equations and Functions
Exam 1: Algebraic Concepts308 Questions
Exam 2: Linear Equations and Functions243 Questions
Exam 3: Quadratic and Other Special Functions113 Questions
Exam 4: Matrices227 Questions
Exam 5: Inequalities and Linear Programming120 Questions
Exam 6: Exponential and Logarithmic Functions108 Questions
Exam 7: Mathematics of Finance131 Questions
Exam 8: Introduction to Probability178 Questions
Exam 9: Further Topics in Probability; Data Description114 Questions
Exam 10: Derivatives248 Questions
Exam 11: Applications of Derivatives172 Questions
Exam 12: Derivatives Continued139 Questions
Exam 13: Indefinite Integrals120 Questions
Exam 14: Definite Integrals: Techniques of Integration185 Questions
Exam 15: Functions of Two or More Variables119 Questions
Select questions type
The equation in this problem leads to a linear equation. Solve for x. Because the solution to the linear equation may not be a solution to the original equation, be sure to check the solution in the original equation. 
(Multiple Choice)
4.8/5  (35)
(35)
It has been estimated that a certain stream can support 55,000 fish if it is pollution-free. It has further been estimated that for each ton of pollutants in the stream, 1,300 fewer fish can be supported. Assuming the relationship is linear, write the equation that gives the population of fish p in terms of the tons of pollutants x.
(Multiple Choice)
4.8/5 (39)
Using data from the Internal Revenue Service, the per capita tax burden T (in hundreds of dollars) can be described by  , where t is the number of years past 1980. Find the value of T in 1997. Round your answer to the nearest dollar.
(Multiple Choice)
4.7/5 (41)
With U.S. Census Bureau data, the model that relates the per capita annual income (in thousands of dollars) of blacks B and whites W was found to be  . Use a graphing utility to graph this equation for the range
  ,
,  ;
;  ,
,  . Is the image below the correct graph of the function?
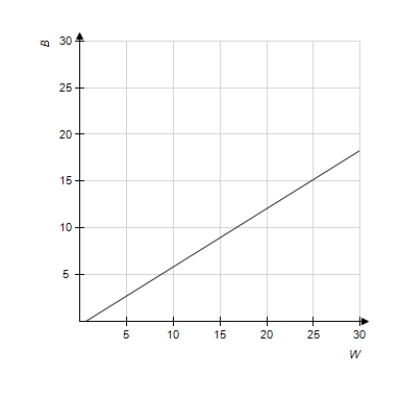
(Multiple Choice)
4.8/5 (37)
Write the equation and graph the line that passes through the given point and has the slope indicated.
 with slope
(Multiple Choice)
4.9/5 (37)
Find the slope m and y-intercept b of the line whose equation is given below. 
(Multiple Choice)
4.8/5 (35)
A function and its graph are given. Find the domain. 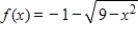
(Multiple Choice)
4.8/5 (32)
Solve the system of equations by using graphical methods. 
(Multiple Choice)
4.8/5 (32)
Write the equation and graph the line that passes through the given point and has the slope indicated.
(5,-2) with slope 3
(Multiple Choice)
4.8/5 (37)
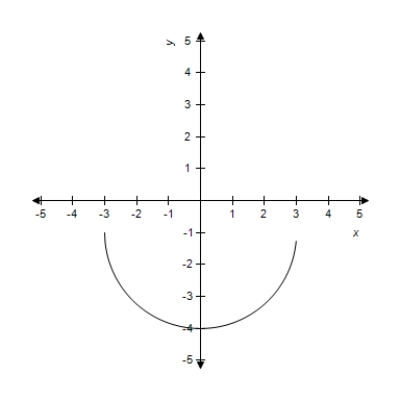
Suppose that a company's revenue  is a function k of the number of customers C. Suppose also that the amount spent on advertising A affects the number of customers so that
  is a function g of A. The function
  is defined, since
  . Is
. Is  defined?
(Multiple Choice)
4.9/5 (30)
Graph the function using a window that gives a complete graph. Does the figure below show the complete graph? 
(Multiple Choice)
5.0/5 (36)
A manufacturer sells watches for $80 per unit. The fixed costs related to this product are $8,000 per month, and the variable costs are $60 per unit. This gives a profit function 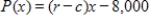 , where r is the revenue per unit and c is the variable cost per unit. If the manufacturer has a profit of zero, how many watches were sold?
(Multiple Choice)
4.9/5 (30)
The Millcreek watershed area was heavily strip-mined for coal during the late 1960s. Because of the resulting pollution, the streams cannot support fish. Suppose the cost C of obtaining stream water that contains p percent of the current pollution levels is given by 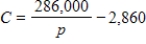 . Because p is the percent of current pollution levels,
  . Use the restriction on p and determine a range for C so that an accurate graph can be obtained with a graphing utility. Describe what happens to the cost as p takes on positive values near 0.
(Multiple Choice)
4.8/5 (34)
Use a graphing utility with the standard viewing window  and
and  to graph the function. Choose the correct graph below.
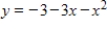
(Multiple Choice)
4.8/5 (29)
When a $801,000 building is depreciated for tax purposes (by the straight-line method), its value y after x months of use is given by 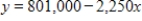 . How many months will it be before the building is fully depreciated (that is, its value is $0)?
(Multiple Choice)
4.9/5 (26)
For a certain product, the revenue function is  and the cost function is
  . To obtain a profit, the revenue must be greater than the cost. Find the graph of x which shows when there is a profit.
(Multiple Choice)
4.9/5 (31)
How many gallons of washer fluid that is 13.5% antifreeze must a manufacturer add to 500 gallons of washer fluid that is 11% antifreeze to yield washer fluid that is 13% antifreeze?
(Multiple Choice)
4.7/5 (37)
In Sweetwater, Arizona, water bills are taxed on the basis of the amount of the monthly bill in order to encourage conservation. If the bill is more than $0 but less than $45, the tax is 2% of the bill; if the bill is $45 or more but less than $65, the tax is 4% of the bill; and if the bill is $65 or more, the tax is 6% of the bill. Choose the inequalities that represent the amounts of tax owed in these three cases, where T is the tax to be paid and B is the monthly bill.
(Multiple Choice)
4.9/5 (36)
Filters
- Essay(0)
- Multiple Choice(0)
- Short Answer(0)
- True False(0)
- Matching(0)