Exam 7: Random Variables and Discrete Probability Distributions
Exam 1: What Is Statistics14 Questions
Exam 2: Types of Data, Data Collection and Sampling16 Questions
Exam 3: Graphical Descriptive Methods Nominal Data19 Questions
Exam 4: Graphical Descriptive Techniques Numerical Data64 Questions
Exam 5: Numerical Descriptive Measures147 Questions
Exam 6: Probability106 Questions
Exam 7: Random Variables and Discrete Probability Distributions55 Questions
Exam 8: Continuous Probability Distributions117 Questions
Exam 9: Statistical Inference: Introduction8 Questions
Exam 10: Sampling Distributions65 Questions
Exam 11: Estimation: Describing a Single Population127 Questions
Exam 12: Estimation: Comparing Two Populations22 Questions
Exam 13: Hypothesis Testing: Describing a Single Population129 Questions
Exam 14: Hypothesis Testing: Comparing Two Populations78 Questions
Exam 15: Inference About Population Variances49 Questions
Exam 16: Analysis of Variance115 Questions
Exam 17: Additional Tests for Nominal Data: Chi-Squared Tests110 Questions
Exam 18: Simple Linear Regression and Correlation213 Questions
Exam 19: Multiple Regression121 Questions
Exam 20: Model Building92 Questions
Exam 21: Nonparametric Techniques126 Questions
Exam 22: Statistical Inference: Conclusion103 Questions
Exam 23: Time-Series Analysis and Forecasting145 Questions
Exam 24: Index Numbers25 Questions
Exam 25: Decision Analysis51 Questions
Select questions type
If X and Y are two independent random variables with V(X) = 6 and V(Y) = 5, then V(3X + 2Y) is: A. 11. B. 158. C. 28. D. 74.
(Short Answer)
4.8/5  (31)
(31)
An analysis of the stock market produces the following information about the returns of two stocks: 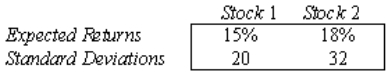 Assume that the returns are positively correlated, with
  12 = 0.80.
a. Find the mean and standard deviation of the return on a portfolio consisting of an equal investment in each of the two stocks.
b. Suppose that you wish to invest $1 million. Discuss whether you should invest your money in stock 1, stock 2, or a portfolio composed of an equal amount of investments on both stocks.
12 = 0.80.
a. Find the mean and standard deviation of the return on a portfolio consisting of an equal investment in each of the two stocks.
b. Suppose that you wish to invest $1 million. Discuss whether you should invest your money in stock 1, stock 2, or a portfolio composed of an equal amount of investments on both stocks.
(Essay)
4.9/5 (35)
The probability distribution for X ,daily demand of a particular newspaper at a local newsagency,( in hundreds) is as follows: x 1 2 3 4 p(x) 0.05 0.42 0.44 0.09 a. Find and interpret the expected value of X.
b. Find V(X).
c. Find .
(Essay)
4.9/5 (26)
Let X be a binomial random variable with n = 25 and p = 0.01.
a. Use the binomial table to find P(X = 0), P(X = 1), and P(X = 2).
b. Approximate the three probabilities in part (a) using the appropriate Poisson distribution.
c. Compare your approximations in part (b) with the exact probabilities found in part (a). What is your conclusion?
(Essay)
4.9/5 (41)
The weighted average of the possible values that a random variable X can assume, where the weights are the probabilities of occurrence of those values, is referred to as the:
(Multiple Choice)
4.9/5 (31)
The standard deviation of a binomial distribution for which n = 100 and p = .35 is:
(Multiple Choice)
4.9/5 (35)
A Bernoulli trial is where each trial of an experiment has four possible outcomes, the probability of success is p and the trials are not independent.
(True/False)
4.9/5 (38)
State whether or not each of the following are valid probability distributions, and if not, explain why not. a.
x 0 1 2 3 p(x) .15 .25 .35 .45
b.
x 2 3 4 5 p(x) -.10 .40 .50 .25
c.
x -2 -1 0 1 2 p(x) .10 .20 .40 .20 .10
(Essay)
4.7/5 (35)
The expected number of heads in 90 tosses of an unbiased coin is: A. 30. B. 45. C. 50. D. 60.
(Short Answer)
4.9/5 (31)
For a discrete probability distribution to be valid, the probabilities must lie between 0 and 1, where the sum of all probabilities must be 1.
(True/False)
4.8/5 (45)
The proprietor of a small hardware store employs three men and three women. He will select three employees at random to work on Christmas Eve. Let X represent the number of women selected.
a. Express the probability distribution of X in tabular form.
b. What is the probability that at least two women will work on Christmas Eve?
(Essay)
4.8/5 (36)
A table, formula, or graph that shows all possible countable values a random variable can assume, together with their associated probabilities, is called a:
(Multiple Choice)
4.8/5 (43)
The joint probability distribution of X and Y is shown in the following table.
Y 1 2 3 1 .30 .18 .12 2 .15 .09 .06 3 .05 .03 .02
a. Determine the marginal probability distributions of X and Y.
b. Are X and Y independent? Explain.
c. Find P(Y = 2 | X = 1).
d. Find the probability distribution of the random variable X + Y.
e. Find E(XY).
f. Find COV(X, Y).
(Essay)
4.9/5 (25)
A recent survey in Victoria revealed that 60% of the vehicles travelling on highways, where speed limits are posted at 100 kilometres per hour, were exceeding the limit. Suppose you randomly record the speeds of 10 vehicles travelling on the Hume Highway, where the speed limit is 100 kilometres per hour. Let X denote the number of vehicles that were exceeding the limit. Find the following probabilities.
a. P(X = 10).
b. P(4 < X < 9).
c. P(X = 2).
d. P(3 X 6).
(Essay)
4.8/5 (29)
Filters
- Essay(0)
- Multiple Choice(0)
- Short Answer(0)
- True False(0)
- Matching(0)