Exam 14: Simple Linear Regression
Exam 1: Data and Statistics84 Questions
Exam 2: Descriptive Statistics: Tabular and Graphical Displays67 Questions
Exam 3: Descriptive Statistics: Numerical Measures118 Questions
Exam 4: Introduction to Probability94 Questions
Exam 5: Discrete Probability Distributions84 Questions
Exam 6: Continuous Probability Distributions121 Questions
Exam 7: Sampling and Sampling Distributions116 Questions
Exam 8: Interval Estimation90 Questions
Exam 9: Hypothesis Tests95 Questions
Exam 10: Inference About Means and Proportions With Two Populations63 Questions
Exam 11: Inferences About Population Variances66 Questions
Exam 12: Comparing Multiple Proportions, Tests of Independence and Goodness of Fit59 Questions
Exam 13: Experimental Design and Analysis of Variance76 Questions
Exam 14: Simple Linear Regression132 Questions
Exam 15: Multiple Regression103 Questions
Exam 16: Regression Analysis: Model Building41 Questions
Exam 17: Time Series Analysis and Forecasting51 Questions
Exam 18: Nonparametric Methods58 Questions
Exam 19: Decision Analysis48 Questions
Exam 20: Index Numbers39 Questions
Exam 21: Statistical Methods for Quality Control60 Questions
Exam 22: Sample Survey48 Questions
Select questions type
You are given the following information about y and x. 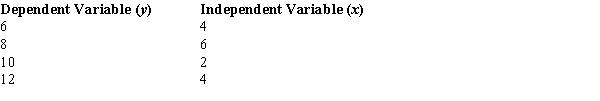 The least squares estimate of the slope or b1 equals
(Multiple Choice)
4.7/5  (30)
(30)
Regression analysis was applied and the least squares regression line was found to be  = 500 + 4x What would the residual be for an observed value of (3, 510)?
(Multiple Choice)
4.8/5 (35)
Regression analysis was applied between sales data (y in $1000s) and advertising data (x in $100s) and the following information was obtained.  = 12 + 1.8x
N = 17
SSR = 225
SSE = 75
Sb1 = .2683
To perform an F test, the p-value is
= 12 + 1.8x
N = 17
SSR = 225
SSE = 75
Sb1 = .2683
To perform an F test, the p-value is
(Multiple Choice)
4.8/5 (35)
The difference between the observed value of the dependent variable and the value predicted using the estimated regression equation is the
(Multiple Choice)
4.8/5 (33)
Regression analysis was applied between sales data (y in $1000s) and advertising data (x in $100s) and the following information was obtained.  = 12 + 1.8x
N = 17
SSR = 225
SSE = 75
Sb1 = .2683
Based on the above estimated regression equation, if advertising is $3000, then the point estimate for sales (in dollars) is
= 12 + 1.8x
N = 17
SSR = 225
SSE = 75
Sb1 = .2683
Based on the above estimated regression equation, if advertising is $3000, then the point estimate for sales (in dollars) is
(Multiple Choice)
4.9/5 (23)
The following information regarding a dependent variable (y) and an independent variable (x) is provided. 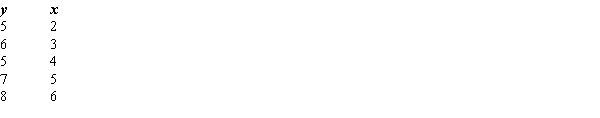 SSE = 1.9
SST = 6.8
The least squares estimate of the y-intercept is
SSE = 1.9
SST = 6.8
The least squares estimate of the y-intercept is
(Multiple Choice)
4.7/5 (36)
In regression analysis, which of the following assumptions is not true about the error term ε?
(Multiple Choice)
4.8/5 (28)
In a regression analysis, the standard error of the estimate is determined to be 4. In this situation, the MSE
(Multiple Choice)
4.7/5 (34)
You are given the following information about y and x. 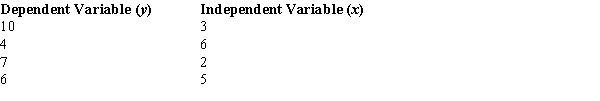 The coefficient of determination equals
(Multiple Choice)
4.7/5 (23)
Regression analysis is a statistical procedure for developing a mathematical equation that describes how
(Multiple Choice)
4.8/5 (33)
If a data set produces SSR = 300 and SSE = 200, then the coefficient of determination is
(Multiple Choice)
4.8/5 (24)
Regression analysis was applied between sales data (y in $1000s) and advertising data (x in $100s) and the following information was obtained.  = 12 + 1.8x
N = 17
SSR = 225
SSE = 75
Sb1 = .2683
The critical t value for testing the significance of the slope, at a .05 level of significance, is
= 12 + 1.8x
N = 17
SSR = 225
SSE = 75
Sb1 = .2683
The critical t value for testing the significance of the slope, at a .05 level of significance, is
(Multiple Choice)
4.8/5 (39)
In regression analysis, the error term ε is a random variable with a mean or expected value of
(Multiple Choice)
5.0/5 (38)
In regression analysis, the model in the form y =  , y is the
(Multiple Choice)
4.8/5 (43)
The following information regarding a dependent variable (y) and an independent variable (x) is provided. 
SSE = 1.9
SST = 6.8
The least squares estimate of the slope is
SSE = 1.9
SST = 6.8
The least squares estimate of the slope is
(Multiple Choice)
4.9/5 (40)
Given the following information, when testing the least squares regression model would give an F Statistic of 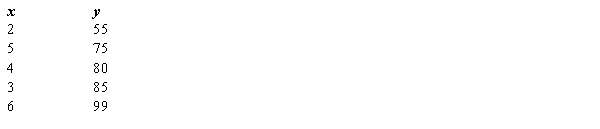
(Multiple Choice)
4.9/5 (38)
A regression and correlation analysis resulted in the following information regarding a dependent variable (y) and an independent variable (x). 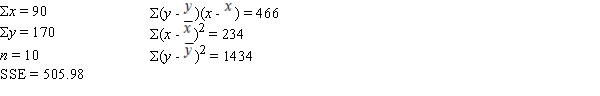 The sample correlation coefficient equals
(Multiple Choice)
4.8/5 (32)
A descriptive measure of the strength of linear association between two variables is the
(Multiple Choice)
4.8/5 (37)
In a regression analysis, if SST = 500 and SSE = 200, then the coefficient of determination is
(Multiple Choice)
5.0/5 (38)
Filters
- Essay(0)
- Multiple Choice(0)
- Short Answer(0)
- True False(0)
- Matching(0)