Exam 14: Simple Linear Regression
Exam 1: Data and Statistics84 Questions
Exam 2: Descriptive Statistics: Tabular and Graphical Displays67 Questions
Exam 3: Descriptive Statistics: Numerical Measures118 Questions
Exam 4: Introduction to Probability94 Questions
Exam 5: Discrete Probability Distributions84 Questions
Exam 6: Continuous Probability Distributions121 Questions
Exam 7: Sampling and Sampling Distributions116 Questions
Exam 8: Interval Estimation90 Questions
Exam 9: Hypothesis Tests95 Questions
Exam 10: Inference About Means and Proportions With Two Populations63 Questions
Exam 11: Inferences About Population Variances66 Questions
Exam 12: Comparing Multiple Proportions, Tests of Independence and Goodness of Fit59 Questions
Exam 13: Experimental Design and Analysis of Variance76 Questions
Exam 14: Simple Linear Regression132 Questions
Exam 15: Multiple Regression103 Questions
Exam 16: Regression Analysis: Model Building41 Questions
Exam 17: Time Series Analysis and Forecasting51 Questions
Exam 18: Nonparametric Methods58 Questions
Exam 19: Decision Analysis48 Questions
Exam 20: Index Numbers39 Questions
Exam 21: Statistical Methods for Quality Control60 Questions
Exam 22: Sample Survey48 Questions
Select questions type
A regression and correlation analysis resulted in the following information regarding a dependent variable (y) and an independent variable (x). 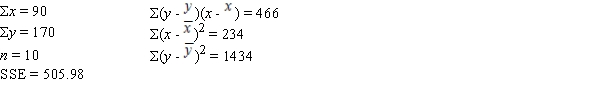 The least squares estimate of the intercept or b0 equals
(Multiple Choice)
4.8/5  (36)
(36)
The following information regarding a dependent variable (y) and an independent variable (x) is provided.  SSE = 1.9
SST = 6.8
The MSE is
SSE = 1.9
SST = 6.8
The MSE is
(Multiple Choice)
4.8/5 (30)
Regression analysis was applied between demand for a product (y) and the price of the product (x), and the following estimated regression equation was obtained.  = 120 - 10x
Based on the above estimated regression equation, if price is increased by 3units, then demand is expected to
= 120 - 10x
Based on the above estimated regression equation, if price is increased by 3units, then demand is expected to
(Multiple Choice)
4.9/5 (37)
The following information regarding a dependent variable (y) and an independent variable (x) is provided. 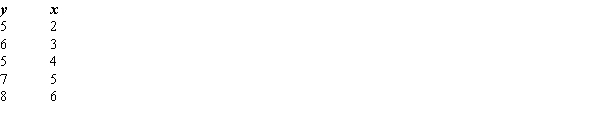 SSE = 1.9
SST = 6.8
The coefficient of correlation is
SSE = 1.9
SST = 6.8
The coefficient of correlation is
(Multiple Choice)
4.8/5 (29)
In a simple linear regression analysis (where y is a dependent and x an independent variable), if the y-intercept is positive, then
(Multiple Choice)
4.7/5 (38)
A regression analysis between sales (y in $1000) and advertising (x in dollars) resulted in the following equation:  = 30,000 + 5x
The above equation implies that an
= 30,000 + 5x
The above equation implies that an
(Multiple Choice)
4.9/5 (32)
For the following data, the value of SSE = 12.75.  The slope of the regression equation is
(Multiple Choice)
4.7/5 (38)
For the following data, the value of SSE = 12.75.  The coefficient of determination (r2) equals
(Multiple Choice)
4.9/5 (30)
If a data set produces SST =1000 and SSE =600, then the coefficient of determination is
(Multiple Choice)
4.8/5 (38)
The interval estimate of an individual value of y for a given value of x is the
(Multiple Choice)
4.9/5 (30)
Compared to the confidence interval estimate for a particular value of y in a linear regression model, the interval estimate for an average value of y will be
(Multiple Choice)
4.8/5 (30)
Filters
- Essay(0)
- Multiple Choice(0)
- Short Answer(0)
- True False(0)
- Matching(0)