Exam 14: Simple Linear Regression
Exam 1: Data and Statistics84 Questions
Exam 2: Descriptive Statistics: Tabular and Graphical Displays67 Questions
Exam 3: Descriptive Statistics: Numerical Measures118 Questions
Exam 4: Introduction to Probability94 Questions
Exam 5: Discrete Probability Distributions84 Questions
Exam 6: Continuous Probability Distributions121 Questions
Exam 7: Sampling and Sampling Distributions116 Questions
Exam 8: Interval Estimation90 Questions
Exam 9: Hypothesis Tests95 Questions
Exam 10: Inference About Means and Proportions With Two Populations63 Questions
Exam 11: Inferences About Population Variances66 Questions
Exam 12: Comparing Multiple Proportions, Tests of Independence and Goodness of Fit59 Questions
Exam 13: Experimental Design and Analysis of Variance76 Questions
Exam 14: Simple Linear Regression132 Questions
Exam 15: Multiple Regression103 Questions
Exam 16: Regression Analysis: Model Building41 Questions
Exam 17: Time Series Analysis and Forecasting51 Questions
Exam 18: Nonparametric Methods58 Questions
Exam 19: Decision Analysis48 Questions
Exam 20: Index Numbers39 Questions
Exam 21: Statistical Methods for Quality Control60 Questions
Exam 22: Sample Survey48 Questions
Select questions type
If the coefficient of determination is .95, the percentage of variation in the dependent variable explained by the variation in the independent variable is
(Multiple Choice)
4.8/5  (30)
(30)
Given the following information, the coefficient of determination is  SSE = 420.4, SST = 1028.8
(Multiple Choice)
4.9/5 (34)
The following information regarding a dependent variable y and an independent variable x is provided: 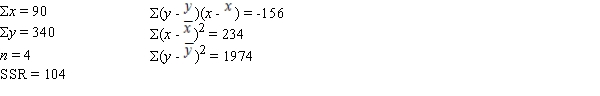 The sum of squares due to error (SSE) is
(Multiple Choice)
4.9/5 (32)
Given the following information, what is the least squares estimate of the slope? 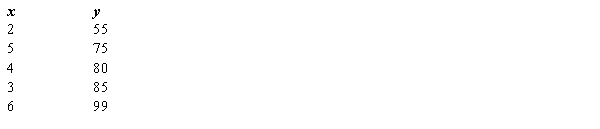
(Multiple Choice)
4.7/5 (32)
In regression analysis, if the independent variable is measured in pounds, the dependent variable
(Multiple Choice)
4.9/5 (27)
Regression analysis was applied between sales (in $1000) and advertising (in $100) and the following regression function was obtained.  = 500 + 4x
Based on the above estimated regression line, if advertising is $10,000, then the point estimate for sales (in dollars) is
= 500 + 4x
Based on the above estimated regression line, if advertising is $10,000, then the point estimate for sales (in dollars) is
(Multiple Choice)
4.9/5 (41)
In regression analysis, the model in the form y =  +
+  x + ε is called the
(Multiple Choice)
4.8/5 (35)
You are given the following information about y and x. 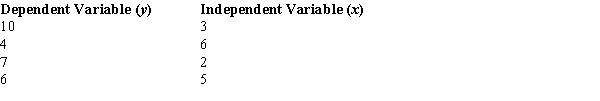 The least squares estimate of the slope or b1 equals
(Multiple Choice)
4.9/5 (37)
Larger values of r2 imply that the observations are more closely grouped about the
(Multiple Choice)
5.0/5 (42)
For the following data, the value of SSE = 12.75.  The total sum of squares (SST) equals
(Multiple Choice)
4.9/5 (34)
A regression and correlation analysis resulted in the following information regarding a dependent variable (y) and an independent variable (x). 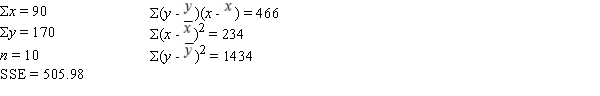 The sum of squares due to regression (SSR) is
(Multiple Choice)
4.9/5 (39)
Regression analysis was applied between sales (in $10,000) and advertising (in $100) and the following regression function was obtained.  = 50 + 8x
Based on the above estimated regression line, if advertising is $1000, then the point estimate for sales (in dollars) is
= 50 + 8x
Based on the above estimated regression line, if advertising is $1000, then the point estimate for sales (in dollars) is
(Multiple Choice)
4.8/5 (35)
For the following data, the value of SSE = 12.75. 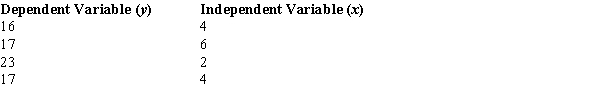 The y-intercept is
(Multiple Choice)
4.9/5 (39)
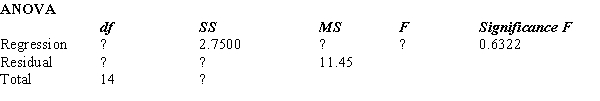
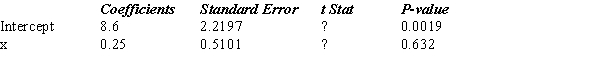
Part of an Excel output relating x (independent variable) and y (dependent variable) is shown below. Fill in all the blanks marked with "?". 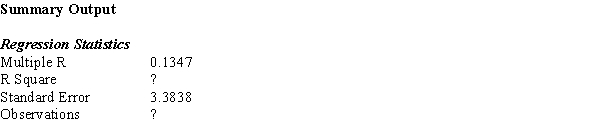
(Short Answer)
4.9/5 (28)
In regression analysis, the model in the form y =  ,
,  is the
(Multiple Choice)
4.9/5 (35)
The interval estimate of the mean value of y for a given value of x is the
(Multiple Choice)
5.0/5 (33)
As the value of the coefficient of determination increases, the
(Multiple Choice)
4.8/5 (22)
Filters
- Essay(0)
- Multiple Choice(0)
- Short Answer(0)
- True False(0)
- Matching(0)