Exam 14: Simple Linear Regression
Exam 1: Data and Statistics84 Questions
Exam 2: Descriptive Statistics: Tabular and Graphical Displays67 Questions
Exam 3: Descriptive Statistics: Numerical Measures118 Questions
Exam 4: Introduction to Probability94 Questions
Exam 5: Discrete Probability Distributions84 Questions
Exam 6: Continuous Probability Distributions121 Questions
Exam 7: Sampling and Sampling Distributions116 Questions
Exam 8: Interval Estimation90 Questions
Exam 9: Hypothesis Tests95 Questions
Exam 10: Inference About Means and Proportions With Two Populations63 Questions
Exam 11: Inferences About Population Variances66 Questions
Exam 12: Comparing Multiple Proportions, Tests of Independence and Goodness of Fit59 Questions
Exam 13: Experimental Design and Analysis of Variance76 Questions
Exam 14: Simple Linear Regression132 Questions
Exam 15: Multiple Regression103 Questions
Exam 16: Regression Analysis: Model Building41 Questions
Exam 17: Time Series Analysis and Forecasting51 Questions
Exam 18: Nonparametric Methods58 Questions
Exam 19: Decision Analysis48 Questions
Exam 20: Index Numbers39 Questions
Exam 21: Statistical Methods for Quality Control60 Questions
Exam 22: Sample Survey48 Questions
Select questions type
The following information regarding a dependent variable y and an independent variable x is provided: Σx = 90
Σ(y -  )(x -
)(x -  ) = -156
Σy = 340
Σ(x -
) = -156
Σy = 340
Σ(x -  )2 = 234
N = 4
Σ(y -
)2 = 234
N = 4
Σ(y -  )2 = 1974
SSR = 104
The coefficient of correlation is
)2 = 1974
SSR = 104
The coefficient of correlation is
(Multiple Choice)
4.7/5  (31)
(31)
If the coefficient of determination is a positive value, then the coefficient of correlation
(Multiple Choice)
4.7/5 (41)
If the coefficient of correlation is a negative value, then the coefficient of determination
(Multiple Choice)
4.8/5 (30)
The mathematical equation relating the independent variable to the expected value of the dependent variable; that is, E(y) = β0 + β1x, is known as the
(Multiple Choice)
4.8/5 (37)
Regression analysis was applied between sales data (y in $1000s) and advertising data (x in $100s) and the following information was obtained.  = 12 + 1.8x
N = 17
SSR = 225
SSE = 75
Sb1 = .2683
The t statistic for testing the significance of the slope is
= 12 + 1.8x
N = 17
SSR = 225
SSE = 75
Sb1 = .2683
The t statistic for testing the significance of the slope is
(Multiple Choice)
4.8/5 (33)
Regression analysis was applied between sales data (y in $1000s) and advertising data (x in $100s) and the following information was obtained.  = 12 + 1.8x
N = 17
SSR = 225
SSE = 75
Sb1 = .2683
The F statistic computed from the above data is
= 12 + 1.8x
N = 17
SSR = 225
SSE = 75
Sb1 = .2683
The F statistic computed from the above data is
(Multiple Choice)
4.9/5 (40)
In regression analysis, the variable that is being predicted is the
(Multiple Choice)
4.9/5 (43)
If the coefficient of determination is equal to 1, then the coefficient of correlation
(Multiple Choice)
4.9/5 (32)
The following information regarding a dependent variable y and an independent variable x is provided: 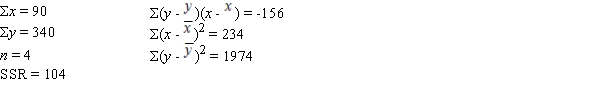 The total sum of squares (SST) is
(Multiple Choice)
4.7/5 (30)
In regression analysis, if the dependent variable is measured in dollars, the independent variable
(Multiple Choice)
4.8/5 (37)
In a regression analysis, if SSE = 200 and SSR = 400, then the coefficient of determination is
(Multiple Choice)
4.8/5 (30)
The following information regarding a dependent variable y and an independent variable x is provided:  The y-intercept is
(Multiple Choice)
4.9/5 (28)
The following information regarding a dependent variable y and an independent variable x is provided:  The mean square error (MSE) is
(Multiple Choice)
4.7/5 (38)
It is not possible for the coefficient of determination to be
(Multiple Choice)
4.9/5 (38)
Filters
- Essay(0)
- Multiple Choice(0)
- Short Answer(0)
- True False(0)
- Matching(0)