Exam 14: Multiple Regression Analysis
Exam 1: The Role of Statistics and the Data Analysis Process17 Questions
Exam 2: Collecting Data Sensibly39 Questions
Exam 3: Graphical Methods for Describing Data25 Questions
Exam 4: Numerical Methods for Describing Data26 Questions
Exam 5: Summarizing Bivariate Data37 Questions
Exam 6: Probability34 Questions
Exam 7: Random Variables and Probability Distributions45 Questions
Exam 8: Sampling Variability and Sampling Distributions27 Questions
Exam 9: Estimation Using a Single Sample46 Questions
Exam 10: Hypothesis Testing Using a Single Sample37 Questions
Exam 11: Comparing Two Populations or Treatments42 Questions
Exam 12: The Analysis of Categorical Data and Goodness-Of-Fit Tests21 Questions
Exam 13: Simple Linear Regression and Correlation: Inferential Methods56 Questions
Exam 14: Multiple Regression Analysis38 Questions
Exam 15: Analysis of Variance40 Questions
Exam 16: Nonparametric Distribution-Free Statistical Methods15 Questions
Select questions type
In the general multiple regression model, y = α + β1x1 + β2x2 + ... + βkxk + e, each observation in the sample consists of k + 1 numbers.
Free
(True/False)
4.9/5  (42)
(42)
Correct Answer: Verified
True
Journalists are trying to find out the main factors used by a railway company in establishing dynamic pricing for tickets. One of the possible regression models, based on the information on 20 tickets, is y = Price for a railway ticket ($) x1 = Number of days before departure x2 = Weekday (1 = Fri/Sat/Sun, 0 = Mon/Tue/Wen/Thu) x3 = Distance (km) x4 = Demand (1 to 5 scale) Using the Minitab output results from fitting this model, carry out the model utility test at a 0.05 significance level. 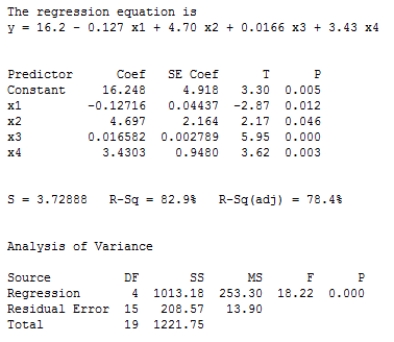
Free
(Multiple Choice)
4.9/5 (51)
Correct Answer:Verified
A
The alternative hypothesis in the model utility test is Ha : none of the β's are 0.
Free
(True/False)
5.0/5 (31)
Correct Answer:Verified
False
In the quadratic regression model, y = α + β1x + β2x2 + e, the parabola opens upward when β2 > 0 and downward when β2 < 0.
(True/False)
5.0/5 (37)
It is possible to carry out the model utility test of H0 : β1 = β2 = ... = βk = 0 when only R2, n, and k are known.
(True/False)
4.7/5 (31)
The least squares estimate of β1 is an unbiased statistic for estimating βi.
(True/False)
4.8/5 (39)
Including an additional predictor to a multiple regression model will always increase the value of the adjusted R2 value.
(True/False)
4.9/5 (34)
A general additive multiple regression model has the form y = α + β1x1 + β2x2 + ... + βkxk.
(True/False)
4.8/5 (34)
When fitting a multiple regression model is desirable to have both a large value of R2 and a small value of se.
(True/False)
4.8/5 (27)
Exhibit 14-1 To comply with recent Federal legislation, school districts must study their students' growth as a whole, as well as the achievement of various subgroups of students. Over a 3-day period, students are assessed on their reading achievement, science and math knowledge, and social studies skills and these results are combined into a global "composite" score. To analyze the increase in this global score from the Freshman year to the Sophomore year, the model y = α + β1x1 + β2x2 + e was fit to a sample of student data. (The actual data contained categorical variables for each ethnic subgroup. To simplify the analysis, only the African American / White categorical variable is included here.)
y = growth in composite score (Soph. - Fresh. score)
x1 = last year's composite score
x2 = 1 if a student is African American, 0 if white
x3 = 1 if a student receives free or reduced price lunch (a measure of socio-economic status), 0 if not
The computer output from the regression analysis is shown below.
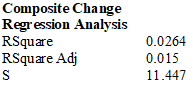
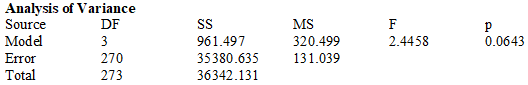
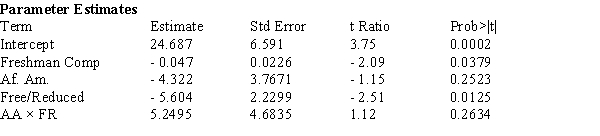
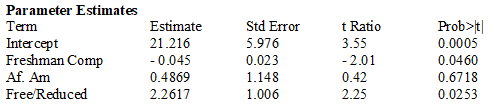 -The data in Exhibit 14-1 were reanalyzed after adding an interaction variable, AAFR, where x4 = x2x3. The computer output is shown below:
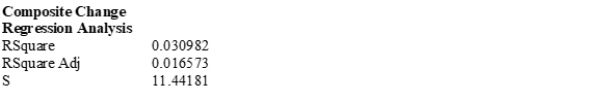
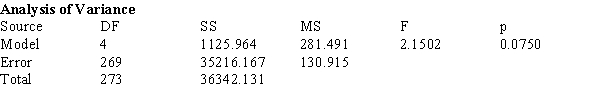
a) Is the Model Utility test significant at the .10 level? Explain your reasoning, referring to specific information in the computer output.
b) Calculate the expected mean growth in composite score for African-American students who scored 280 as Freshmen and are receiving free/reduced lunch.
c) One concern the Federal legislation is intended to address are differences in the school's impact on disadvantaged youngsters. Using the computer output from the interaction model, what, if any, differences in growth scores on the Composite Score from the Freshman to Sophomore year are statistically significant at the .05 level? Does it appear that the different subgroups have different amounts of growth? Justify your reasoning with appropriate references to the data analysis presented in the computer output.
(Essay)
4.8/5 (36)
The president of a manufacturing firm used a regression model of the form y = α + β1x1 + β2x2 + β3x3 + e to study the relationship between the variables
y = production cost (in dollars)
x1 = machine time to produce one unit of the product (in minutes)
x2 = material and labor costs per unit (in dollars)
x3 = percentage of defective products produced All of seven of the possible models containing combinations of these three variables were fit resulting in the summary table below 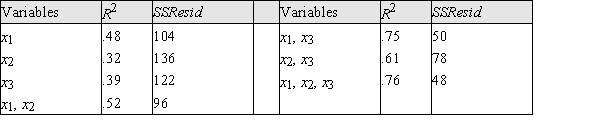
a) If n = 20, compute the value of the adjusted R2 statistic for each of the 7 models.
b) Which of the single variable models is the best? Explain your choice in a few sentences.
c) Let model A be the model with variables x1, x2, and model B be the model with variables x1, x2, x3. Which of these two models appears to be the better model? Explain your choice in a few sentences.
d) Which of the seven models appears to be the best overall model? Explain your choice in a few sentences.
(Essay)
4.8/5 (32)
Exhibit 14-1 To comply with recent Federal legislation, school districts must study their students' growth as a whole, as well as the achievement of various subgroups of students. Over a 3-day period, students are assessed on their reading achievement, science and math knowledge, and social studies skills and these results are combined into a global "composite" score. To analyze the increase in this global score from the Freshman year to the Sophomore year, the model y = α + β1x1 + β2x2 + e was fit to a sample of student data. (The actual data contained categorical variables for each ethnic subgroup. To simplify the analysis, only the African American / White categorical variable is included here.)
y = growth in composite score (Soph. - Fresh. score)
x1 = last year's composite score
x2 = 1 if a student is African American, 0 if white
x3 = 1 if a student receives free or reduced price lunch (a measure of socio-economic status), 0 if not
The computer output from the regression analysis is shown below.
-Refer to Exhibit 14-1. a) Is the Model Utility test significant at the .10 level? Explain your reasoning, referring to specific information in the computer output.
b) Calculate the estimated mean growth in composite score for white students who scored 280 as Freshmen and who are receiving free/reduced lunch.
(Essay)
4.8/5 (34)
A Senate committee is studying the cost of health care and is interested in the relationship between y = the monthly premium paid, x1 = the age of the policy holder, and x2 = the number of dependents on the policy. Partial computer output for the Senate study is given below. The regression equation is Prem = 177 + 1.3 x1 + 68 x2 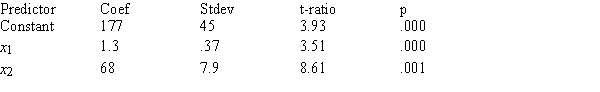 S = 17.25 R-sq = 59.1%
 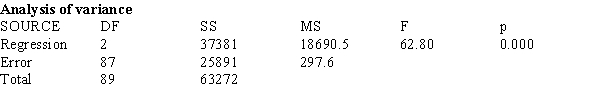 Use a significance level of .05 for all tests requested.
a) Calculate and interpret a 95% confidence interval for β2.
b) Does the model appear to be useful? Test the relevant hypothesis.
c) Conduct a test for the following pair of hypotheses: H0 : β1 = 0 vs. β1 ≠ 0.
d) Based on your result in part (c), would you conclude that the age of the policy holder is an important variable? Explain your reasoning.
e) An estimate of the mean monthly premium for a policy holder 23 years old with 2 dependents is desired. Compute a 90% confidence interval for α + β1(23) + β2(2) if the estimated standard deviation of a + b1(23) + b2(2) is 35. Interpret the resulting interval.
f) A single individual, 23 years old with 2 dependents, is identified. Predict the monthly premium for this person using a 90% interval.
Use a significance level of .05 for all tests requested.
a) Calculate and interpret a 95% confidence interval for β2.
b) Does the model appear to be useful? Test the relevant hypothesis.
c) Conduct a test for the following pair of hypotheses: H0 : β1 = 0 vs. β1 ≠ 0.
d) Based on your result in part (c), would you conclude that the age of the policy holder is an important variable? Explain your reasoning.
e) An estimate of the mean monthly premium for a policy holder 23 years old with 2 dependents is desired. Compute a 90% confidence interval for α + β1(23) + β2(2) if the estimated standard deviation of a + b1(23) + b2(2) is 35. Interpret the resulting interval.
f) A single individual, 23 years old with 2 dependents, is identified. Predict the monthly premium for this person using a 90% interval.
(Essay)
4.7/5 (32)
In the quadratic regression model, y = α + β1x + β2x2 + e, β2 can be interpreted as the amount that y will be expected to change when the value of x is increased by one unit.
(True/False)
4.9/5 (35)
A complete second order regression model in the variables x1 and x2 is given by y = α + β1x1 + β2x2 + β3x12 + β4x22 +
e.
(True/False)
4.7/5 (38)
The owners of an online shop use a multiple regression model with three independent variables where y = Shipping Cost ($) x1 = Product weight (kg) x2 = Number of items x3 = Total amount ($) The regression model is y = 8.50 + 12x1 + 0.1x2 + 0.05x3 + 0.08x2x3 + e Interpret the value of β1 for this model.
(Multiple Choice)
4.8/5 (40)
The estimated regression function 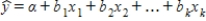 is used for both estimating the mean value of y and predicting the value of y when x1, x2, ..., xk are fixed values.
(True/False)
4.8/5 (34)
Filters
- Essay(0)
- Multiple Choice(0)
- Short Answer(0)
- True False(0)
- Matching(0)