Exam 7: Random Variables and Probability Distributions
Exam 1: The Role of Statistics and the Data Analysis Process17 Questions
Exam 2: Collecting Data Sensibly39 Questions
Exam 3: Graphical Methods for Describing Data25 Questions
Exam 4: Numerical Methods for Describing Data26 Questions
Exam 5: Summarizing Bivariate Data37 Questions
Exam 6: Probability34 Questions
Exam 7: Random Variables and Probability Distributions45 Questions
Exam 8: Sampling Variability and Sampling Distributions27 Questions
Exam 9: Estimation Using a Single Sample46 Questions
Exam 10: Hypothesis Testing Using a Single Sample37 Questions
Exam 11: Comparing Two Populations or Treatments42 Questions
Exam 12: The Analysis of Categorical Data and Goodness-Of-Fit Tests21 Questions
Exam 13: Simple Linear Regression and Correlation: Inferential Methods56 Questions
Exam 14: Multiple Regression Analysis38 Questions
Exam 15: Analysis of Variance40 Questions
Exam 16: Nonparametric Distribution-Free Statistical Methods15 Questions
Select questions type
Inspecting meat is a very important part of the process of ensuring healthy food. So that meat inspectors do not fall into a pattern of inspection, they use a 4-sided die to decide whether or not to sample the meat from a particular "side" of beef. The meat inspector rolls the die and if it comes up a 4, a sample is taken of that meat. Forty sides of beef are available for possible inspection. Define random variable x = number of sides selected for inspection out of the 40 available.
a) What is the mean of the random variable x?
b) What is the standard deviation of the random variable x?
Free
(Essay)
4.7/5  (35)
(35)
Correct Answer: Verified
a) mean: μx = nπ = 40(.25) = 10
b) standard deviation: 
In the old Roman Coliseum, two horses would be placed in tandem (side by side) and hitched to a chariot. Since the fast chariots needed to be able to pass the slow chariots, it was of some importance that the horses have room to run, but also they should not be too large. For chariot hitching purposes, the widest measure across a horse occurs in the rump area. The mean rump width is approximately 27" with a standard deviation of about 2". Let random variable w = width in inches across the rump of a randomly selected horse
a) The usual length measure as it applies to horses is the "hand," which is by definition equal to 4". Define random variable h = width in hands across the rump of a randomly selected horse. What are the mean and standard deviation of h?
b) Suppose horses are randomly chosen for a particular Roman chariot. Define random variable c = h1 + h2 to be the rump width of two randomly selected horses. What are the mean and standard deviation of c?
c) Suppose that in the original chariot design a 16 inch separation of the horses is specified so that the horses have room to avoid each other. This leads to random variable a = 16 + w1 + w2. Describe how this addition of 16 inches of "wiggle room" would change the mean and standard deviation in part (b). Do not recalculate the mean and standard deviation.
Free
(Essay)
4.9/5 (31)
Correct Answer:Verified
a) μh = μ(w / 4) = μw / 4 = 6.75 hands σh = σ(w / 4) = σw / 4 = 0.5 hands
b) μh = 2 · μw = 54'' ![a) μ<sub>h</sub> = μ(w / 4) = μ<sub>w</sub> / 4 = 6.75 hands σ<sub>h</sub> = σ(w / 4) = σ<sub>w</sub> / 4 = 0.5 hands b) μ<sub>h</sub> = 2 · μ<sub>w</sub> = 54'' c) The mean would increase by 16 inches. [to 64] The standard deviation would be unchanged. [2.83]](https://storage.examlex.com/TB7678/11eb136f_485e_ec84_8021_9b1ca8d19bed_TB7678_00.jpg)
c) The mean would increase by 16 inches. [to 64"] The standard deviation would be unchanged. [2.83"]
When planning for the big Statistics Department Super Bowl party, it is sometimes not clear what kinds of chips that people will want to have available, nor is it clear how many people will actually show up at the party. Because of this Professor Mean takes a 4-sided die to the grocery store, starts at one end of the chips aisle, and travels to the other end. At each different kind of chips, Dr. Mean rolls the die. If it comes up a 4, she purchases the chips for the party. There are 40 different kinds of chips in the aisle. Define random variable x = number of types of chips purchased out of 40. a) What is the mean of the random variable x? b) What is the standard deviation of the random variable x?
Free
(Essay)
4.9/5 (37)
Correct Answer:Verified
a) mean: μx = nπ = 40(.25) = 10
b) standard deviation: 
In a certain very large city, the Department of Transportation (D.O.T.) has organized a complex system of bus transportation. In an advertising campaign, citizens are encouraged to use the new "GO-D.O.T!" system and head for the nearest bus stop to be transported to and from the central city. Suppose that at one of the bus stops the amount of time (in minutes) that a commuter must wait for a bus is a uniformly distributed random variable, T. The values of T run from 0 minutes to 30 minutes.
a) Sketch the probability distribution of T.
b) What is the probability that a random commuter will spend more than 12 minutes waiting for GO-D.O.T?
(Essay)
4.7/5 (36)
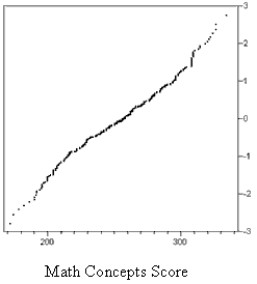
The graphs below are normal probability plots of the vocabulary and math concept scores on a standardized exam for a large sample of students. One of the score distributions is approximately normal. Identify the score distribution that is approximately normal and explain the reason for your choice. 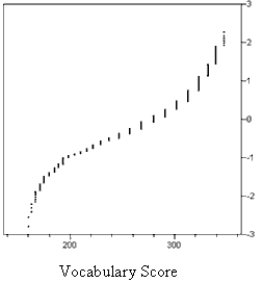
(Essay)
4.8/5 (29)
The owners of the Burger Emporium are looking for new supplier of tomatoes for their famous hamburgers. It is important that the tomato slice be roughly the same diameter as the hamburger patty. After careful analysis, they determine that they can only use tomatoes with diameters between 9 and 10 cm. Company A provides tomatoes with diameters that are approximately normally distributed with mean 10.5 cm and standard deviation of 1.1 cm. Company B provides tomatoes with diameters that are approximately normally distributed with mean 10.3 cm and standard deviation of 0.8 cm. Which company provides the higher proportion of usable tomatoes? Justify your choice with an appropriate statistical argument.
(Essay)
4.9/5 (40)
In a certain very large city, the Department of Transportation (D.O.T.) has organized a complex system of bus transportation. In an advertising campaign, citizens are encouraged to use the new "GO-D.O.T!" system and head for the nearest bus stop to be transported to and from the central city. Suppose that at one of the bus stops the amount of time (in minutes) that a commuter must wait for a bus is a uniformly distributed random variable, T. The possible values of T run from 0 minutes to 20 minutes.
a) Sketch the probability distribution of T.
b) What is the probability that a randomly selected commuter will spend more than 7 minutes waiting for GO-D.O.T?
(Essay)
4.8/5 (39)
A random variable is discrete if the value of the random variable depends upon the outcome of a chance experiment.
(True/False)
4.9/5 (33)
Briefly describe how the correlation coefficient can be used to check for normality.
(Essay)
4.9/5 (36)
A State Dept. of Education is writing a state-wide math test, and by law must decide how many points will count as a "failing score." The test consists of 50 True/False questions and 40 multiple choice questions with 5 answer options. The total score (TS) will be equal to the number of true/false items correct plus twice the number of multiple-choice items correct. A decision has been made to make the failing score the score that a student would be expected to get if they randomly guessed on all the questions.
a) If a student is randomly guessing, the 50 True/False questions can be regarded as a binomial chance experiment with probability of success equal to 0.50. If we define the random variable T = score from T/F items, what are the mean and standard deviation of T for a random student who is guessing?
b) If a student is randomly guessing, the 40 multiple choice questions can be regarded as a binomial chance experiment with probability of success equal to 0.20. If we define the random variable M = score from MC items, what are the mean and standard deviation of the M for a random student who is guessing?
c) The total score, TS, is a random variable formed by calculating T + 2M. What are the mean and standard deviation of the random variable TS?
d) If a student is randomly guessing on the multiple choice part of the test, what is the probability that the first multiple choice question correct is the 4th multiple choice question?
(Essay)
4.9/5 (28)
While playing Monopoly, Andi estimated the probabilities of the non-zero rents according to the following probability distribution:  Consider the random variable x = dollar amount in rent collected in a Monopoly roll.
a) If the table above specifies the probability distribution of x, what is the mean of the random variable x?
b) If the probabilities are associated with the outcomes as in the table above, what is the standard deviation of the random variable x?
Consider the random variable x = dollar amount in rent collected in a Monopoly roll.
a) If the table above specifies the probability distribution of x, what is the mean of the random variable x?
b) If the probabilities are associated with the outcomes as in the table above, what is the standard deviation of the random variable x?
(Essay)
4.9/5 (37)
In a study of the reaction times of left- and right-handers' reaction times to tones delivered to the right ear, the right-handers' scores were approximately normally distributed with a mean of 210 milliseconds and standard deviation of 40 milliseconds. The mean score for left-handers was 240 ms.
a) Sketch a normal distribution that describes right-handers' reaction times, and locate the mean reaction time for left-handers in this distribution.
b) About what proportion of right-handers reaction times would be "better" (i.e. smaller) than the mean reaction time for left-handers?
(Essay)
4.8/5 (24)
During World War II The German forces launched "flying-bombs" (missiles) against London. In a study of the effectiveness of these flying-bombs, a researcher divided the south of London into 575 squares of area equal to 0.25 square km and counted the number of these squares that had sustained exactly k hits. The data for 0 - 4 hits in an area is given in the table below. 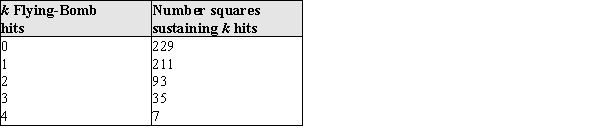 Let the random variable x = number of flying-bombs hitting in a randomly selected square in south London.
 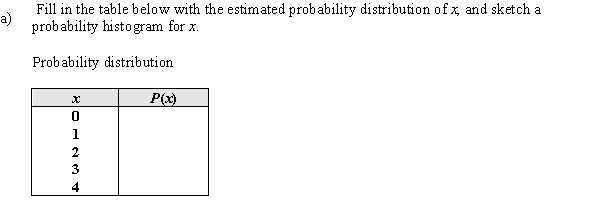 Probability historgram
  b) Using your estimated probabilities in part (a), estimate the following: i) P(x = 1), the probability that 1 flying bomb hit in a randomly selected square. ii) P(x < 3), the probability that fewer than 3 flying bombs hit. iii) P(x ≥ 3), the probability that at least 3 flying bombs hit.
(Essay)
4.8/5 (42)
In a study of the reaction times of left- and right-handers' reaction times to tones delivered to the right ear, the right-handers' scores were approximately normally distributed with a mean of 240 milliseconds and standard deviation of 32 milliseconds. The mean score for right-handers was 210 ms.
a) Sketch a normal distribution that describes left-handers' reaction times, and locate the mean reaction time for right-handers in this distribution.
b) About what proportion of left-handers reaction times would be "better" (i.e. smaller) than the mean reaction time for right-handers?
(Essay)
4.7/5 (41)
At the last home football game, the senior football players walk through a specially constructed welcoming arch, 2 abreast. It is considered unseemly to bump each other on the way through, so the arch must be wide enough for two players to go through. The distribution of widths of football players with shoulder pads on is approximately normal; the mean padded football player width is 30 inches, and the standard deviation is 5 inches. Let random variable w = width in inches of a randomly selected padded football player.
a) Since this is a statistics test, the carpenter who will be constructing the arch has only metric measuring tools, and must convert all the information above to metric measures. 1 inch = 2.54 centimeters, and we define random variable m = width in centimeters of a randomly selected padded football player. What are the mean and standard deviation of m?
b) Suppose the football players are paired randomly to go through the arch. Define random variable v = w1 + w2 to be the collective width (in inches) of two randomly selected football players. What are the mean and standard deviation of v?
c) Suppose that in the original specifications of the arch a 10 inch separation of the football players is specified so that the football players have room to avoid each other. This leads to random variable a = 10 + w1 + w2. Describe how this addition of 10 inches of "wiggle room" would change the mean and standard deviation in part (b). Do not recalculate the mean and standard deviation.
(Essay)
4.9/5 (28)
The time that it takes a randomly selected employee to perform a certain task is approximately normally distributed with a mean value of 120 seconds and a standard deviation of 20 seconds. The slowest 10% (that is, the 10% with the longest times) are to be given remedial training. What times qualify for the remedial training?
(Essay)
4.7/5 (34)
The sales of a newsmagazine vary from week to week, depending on the importance of the news of the previous week. From empirical data over many years, the following distribution of sales (rounded to the nearest million) has been carefully constructed. What are the mean and standard deviation of this distribution? 
(Essay)
4.8/5 (33)
Filters
- Essay(0)
- Multiple Choice(0)
- Short Answer(0)
- True False(0)
- Matching(0)