Exam 12: The Analysis of Categorical Data and Goodness-Of-Fit Tests
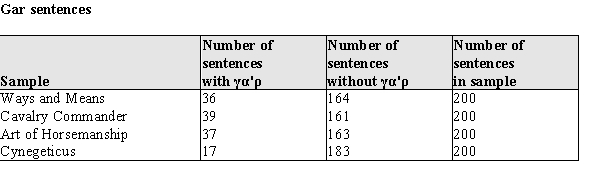
The authorship of ancient writings is frequently in dispute. One method for judging authorship of writings from the Classical Greek period is to analyze the proportion of sentences containing the word, γα'ρ. (γα'ρ is an article, something like "a," "an," and "the" in English.) If a particular collection of works has markedly different frequencies of use of γα'ρ, this would be considered evidence against the same author having written all the works. In the table below, data from random samples of 200 sentences each from 4 works are presented. The alleged author of these works is Xenophon (c. 428 -
c. 45 BCE), a Greek soldier.
a)
At the .05 level of significance, test the hypothesis that the frequencies of the use of γα'ρ is the same for these 4 works.
b)
Write a short paragraph that could be added to a history or Classics Studies textbook that explains your results. Since your audience cannot be assumed to know any statistics, you must explain your conclusions and reasoning in, so to speak, "plain English."
a) 1) The relevant hypotheses are:
2) H0 : The true proportions of the use of γα'ρ are the same in all 4 works.
3) Ha : They are not.
4) α = .05
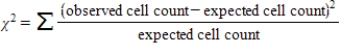
5) 
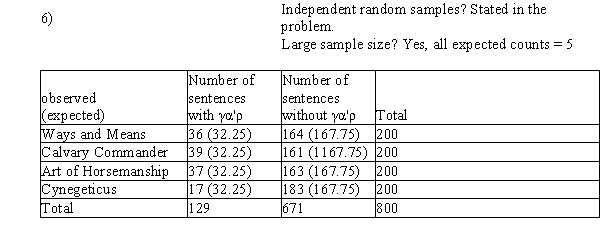
7) χ2 = 11.64 df = 3
8) P-value = P(χ2 > 11.64) = .0087
9) Since the P-value < α, we reject H0. We conclude that frequencies of the use of γα'ρ are not the same in the 4 works.
b) If the four works are really by the same author, we would expect the word γα'ρ to occur with the same frequency in each work. In our samples, the frequencies were not the same, but they were similar. There are two explanations for these differences. First, it is possible that they are different because they are written by different authors. It is faintly possible that they are different simply by chance due to the fact that they come from a random sample, which may not exactly resemble the population is drawn from. However, it is very unlikely to get differences like the ones in our sample simply by chance (p = .0087). Thus, we should conclude that at least one of the works is by a different author.
The shoe company plans the number of shoe pairs of each size before the release of a new men's collection. To do this, sales data from several outlets in the last month were taken. Minitab was used to perform a chi-square goodness-of-fit test for these data. The proportion of each size which was used for the last collection is in the "Test proportion" column. Interpret the Minitab output to determine whether the size proportions for the new collection should be changed. Use a significance level of 0.01. 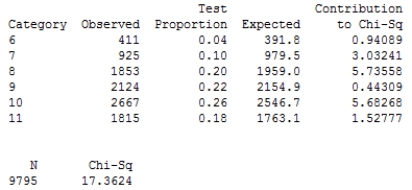
A
The owner of a stationary and office supplies online store is interested in whether the day of the week affects the number of visitors who made purchases. The null hypothesis is that the number of buyers does not depend on the weekday. Throughout the week the number of buyers was counted. Minitab was used to perform a chi-square goodness-of-fit test for these data. Using the Minitab output and a significance level of α = 0.1, determine the P-value and carry out a test of the null hypothesis. 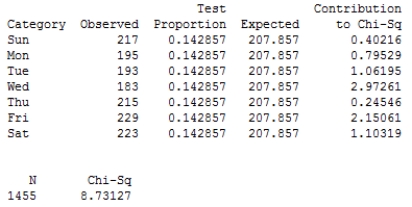
E
For a sample size n, there are n − 1 degrees of freedom associated with the goodness-of-fit test statistic, χ2.
The expected cell count for the row a and column b entry in a bivariate contingency table is equal to the product of the row a and column b marginal totals.
Chi-squared tests for independence and chi-squared tests for homogeneity lead to the same conclusions.
The chi-squared test statistic, χ2, measures the extent to which the observed cell counts differ from those expected when H0 is true.
The chi-squared test statistic for testing independence in a two-way tables has rc − 1 degrees of freedom.
The row and column marginal totals provide information on the distribution of the observed values for each of the two variables defining the contingency table.
Some people believe that criminals who plead guilty will, on average, get lighter sentences. The following table summarizes data from a random sample of San Francisco defendants in burglary cases. 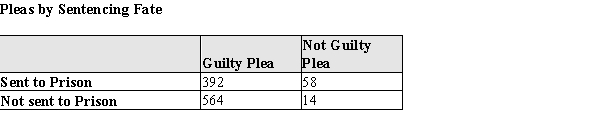 If the null hypothesis is that the plea and the sentencing fate are independent, perform the calculations to find the expected number of individuals who plead guilty and are sent to prison. Show your work.
The use of a chi-squared distribution is appropriate when the sample size is large enough for every observed cell count to be at least 5.
A question of interest to game managers is the hunting strategy of predators. Do they just take the first prey that comes along, or are the selective? In a study of winter prey selection in a National Park, radio-tagged wolves were observed to have killed prey according to the table below. Wolves were identified as the predators by their tracks in the snow. At the most recent census in the National Park there were about 3,500 white-tailed deer, 1,000 elk, and 500 moose. 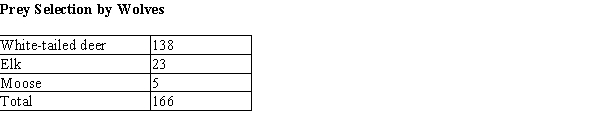 Do these data provide sufficient evidence at the .05 level that the wolves are not selecting their prey at random? That is, is there evidence that the proportion of deer, elk, and moose killed by wolves are not in the same proportion as in the park population? Justify your response with an appropriate statistical analysis.
The article from a local newspaper states that there was convincing evidence of a dependence between the preferred cultural outings (cinema, concerts, exhibitions, or theater) and the presence of children. The author makes a conclusion that having children can affect people's leisure, they may start to prefer cultural outings different from those that they had attended before. Citizens who have kids are more likely to go to theaters and exhibitions. Use the Minitab output and a 0.05 significance level to carry out a chi-squared test for independence. Is it justified to conclude that cultural outings are more preferable for families with children? 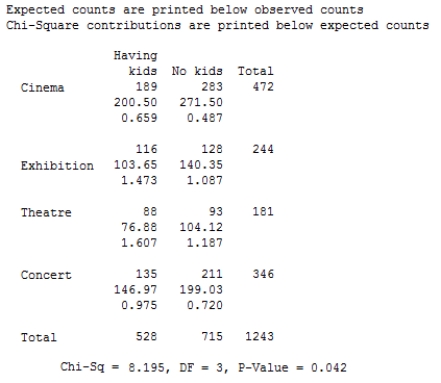
The formulas for the expected cell counts and degrees of freedom for the chi-squared test used to test whether the true category proportions of two or more populations are computed in the same way as for the chi-squared test of the independence of two variables.
Some people believe that criminals who plead guilty will, on average, get lighter sentences. The following table summarizes data from a random sample of San Francisco defendants in burglary cases.  If the null hypothesis is that the plea and the sentencing fate are independent, perform the calculations to find the expected number of individuals who plead not guilty and are sent to prison. Show your work.
Scandinavian researchers investigated the effects of hunting male bears on succeeding generations. (The effects of hunting females on successive generations are well documented.) They hypothesized that when a male is killed a new male will move in, and maximize his reproductive success by killing existing cubs (so that the females will conceive sooner.) A random sample of radio tagged females was monitored and data on the number of bear cubs surviving 1.5 years were gathered. In the southern area, hunters killed bears legally; in the northern area, no hunting took place. The data on cub survival in this sample are reproduced below. The researcher suspects an association between the location of the females and cub survival. 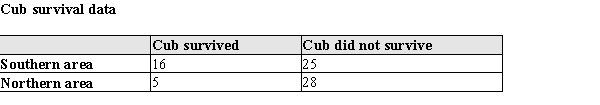 a) What is the appropriate null hypothesis for this investigation? (You may state this hypothesis in ordinary English if you wish.)
b) Using the hypothesis from part (a), test the null hypothesis using the appropriate chi-square procedure.
a) What is the appropriate null hypothesis for this investigation? (You may state this hypothesis in ordinary English if you wish.)
b) Using the hypothesis from part (a), test the null hypothesis using the appropriate chi-square procedure.
As every airline passenger knows, there are never enough armrests! Over the course of 20 flights occurring over a variety of weekdays, nights, and weekends, researchers selected a random sample of passengers that had been seated next to individuals of opposite gender. The passengers were surveyed as they left the boarding area. The researchers were interested in the level of agitation felt when their "seat-mate" used the common armrest. Only one person was randomly selected to be interviewed from a seat-mate pair, and couples were excluded from the survey. The question of interest was whether males and females are equally bothered by their opposite gender's use of the common armrest. The table below summarizes data gathered from interviewing the passengers. 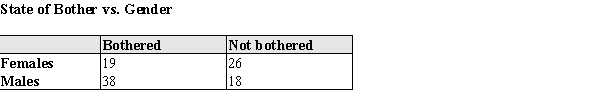
a) What is the appropriate null hypothesis for this investigation? (You may state this hypothesis in ordinary English if you wish.)
b) Using the hypothesis from part (a), test the null hypothesis using the appropriate chi-square procedure.
a) What is the appropriate null hypothesis for this investigation? (You may state this hypothesis in ordinary English if you wish.)
b) Using the hypothesis from part (a), test the null hypothesis using the appropriate chi-square procedure.
For the chi-squared goodness-of-fit chi-squared test, the associated P-value is the area under the appropriate chi-squared curve to the left of the calculated value of χ2.
A chi-squared goodness-of-fit can be used to test hypotheses about the proportion of the population falling into each of the possible categories.
In order to decide whether the observed data is compatible with the null hypothesis, the observed cell counts are compared to the cell counts that would be expected when the alternative hypothesis is true.
Filters
- Essay(0)
- Multiple Choice(0)
- Short Answer(0)
- True False(0)
- Matching(0)