Exam 6: Probability
Exam 1: The Role of Statistics and the Data Analysis Process17 Questions
Exam 2: Collecting Data Sensibly39 Questions
Exam 3: Graphical Methods for Describing Data25 Questions
Exam 4: Numerical Methods for Describing Data26 Questions
Exam 5: Summarizing Bivariate Data37 Questions
Exam 6: Probability34 Questions
Exam 7: Random Variables and Probability Distributions45 Questions
Exam 8: Sampling Variability and Sampling Distributions27 Questions
Exam 9: Estimation Using a Single Sample46 Questions
Exam 10: Hypothesis Testing Using a Single Sample37 Questions
Exam 11: Comparing Two Populations or Treatments42 Questions
Exam 12: The Analysis of Categorical Data and Goodness-Of-Fit Tests21 Questions
Exam 13: Simple Linear Regression and Correlation: Inferential Methods56 Questions
Exam 14: Multiple Regression Analysis38 Questions
Exam 15: Analysis of Variance40 Questions
Exam 16: Nonparametric Distribution-Free Statistical Methods15 Questions
Select questions type
Two events are said to be disjoint or mutually exclusive when they have no outcomes in common.
Free
(True/False)
4.9/5  (35)
(35)
Correct Answer: Verified
True
An event consisting of exactly one outcome is called a simple event.
Free
(True/False)
4.8/5 (24)
Correct Answer:Verified
True
Two events are independent if they cannot occur simultaneously.
Free
(True/False)
4.9/5 (28)
Correct Answer:Verified
False
The event "A or B" consists of all of the outcomes in both of the events.
(True/False)
4.8/5 (35)
The probability of an event E can always be computed using the formula, 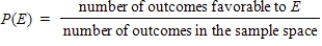
(True/False)
4.8/5 (30)
In order to ensure the safety of school classrooms the local Fire Marshall does an inspection at Thomas Jefferson High School every month, looking for faulty wiring, overloaded circuits, etc. At TJHS the new Academic Wing has 5 math rooms, 10 science rooms, and 10 English rooms. The science rooms are divided into 8 biology and 2 chemistry rooms. Each month, the Fire Marshall randomly picks one of the rooms in the new wing to inspect each month. Define the following events: S = the event the selected room is a science room B = the event the selected room is a biology room M = the event the selected room is a math room E = the event the selected room is an English room C = the event the selected room is a chemistry room Calculate the probabilities of the events described below:
a) P(S)
b) P(M or E )
c) P(E or B) d) P(S and not C)
(Essay)
4.8/5 (32)
Select the correct statement concerning the Law of Total Probability and conditional probability.
(Multiple Choice)
4.9/5 (25)
In a few sentences, explain the difference between conditional probability and "ordinary" (unconditional) probability.
(Essay)
4.7/5 (30)
Experimental studies utilize blinding to prevent researchers from biasing their measurements of the patients. But can they guess the treatment? In a study of a drug intervention, clinicians who were "blinded" were asked to guess what treatment their patients received. Data from that experiment are shown below. Assume that these data are indicative of the population of these treatments.  a) If a subject is selected at random, what is the probability that the researcher correctly guesses the treatment? b) If a randomly chosen subject received the standard treatment, what is the probability that the researcher correctly guesses the treatment?
(Essay)
4.8/5 (30)
Consider the chance experiment in which a high school principal selects a sports event at random to attend. The sex of the participants (Male or Female) is noted, as well as the type of event (Wrestling, Volleyball, Basketball, or Swimming).
a) Display the possible outcomes of this selection using a tree diagram.
b) Let M be the event that the participants are male and B be the event that a ball is involved (i.e. basketball or volleyball).
i) What outcomes are in BC?
ii) What outcomes are in  ?
iii) What outcomes are in
?
iii) What outcomes are in  ?
?
(Essay)
4.8/5 (36)
Exhibit 6-1 In a survey of airline travelers, subjects were observed in the coach section of airplanes to determine if men or women are bothered by a seatmate of the opposite gender using the common armrest. ("Passengers who were asleep or lovers cuddled together were not counted, since these were considered confounding circumstances.") The table below contains data gathered in that study. 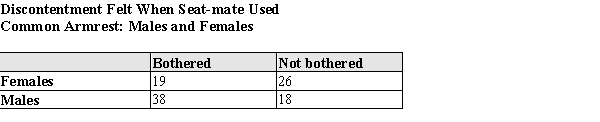 Suppose one of these passengers was randomly selected. Use the information in the table to answer the questions below. In showing your work, define and use appropriate notation.
-In the study in Exhibit 6-1, passengers were also classified by age:
Suppose one of these passengers was randomly selected. Use the information in the table to answer the questions below. In showing your work, define and use appropriate notation.
-In the study in Exhibit 6-1, passengers were also classified by age: 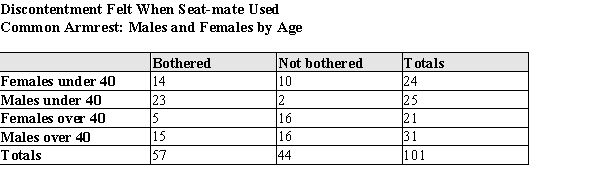 Suppose one of these passengers was randomly selected. Calculate the probability that:
a) The passenger is under 40, given that she is female.
b) The passenger was bothered, given that the passenger was over 40.
c) The passenger was male and over 40.
Suppose one of these passengers was randomly selected. Calculate the probability that:
a) The passenger is under 40, given that she is female.
b) The passenger was bothered, given that the passenger was over 40.
c) The passenger was male and over 40.
(Essay)
4.9/5 (42)
In a special report, "Speed Demons," in the Cedar Rapids, IA, Gazette, reporters used a radar gun to check the speeds of motorists in two counties. They were shocked (!) to discover that some motorists were driving at a speed greater than the posted limits. They reported the following information: 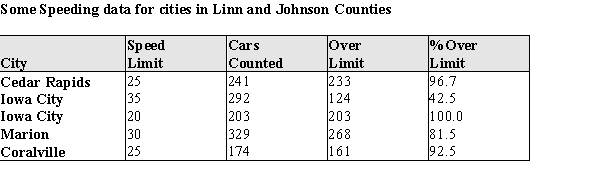 Suppose that one of these cars is selected at random. Consider the following events: F = the event that a driver is in a "fast lane" (speed limit above 25 mph). S = the event that a driver is speeding.
 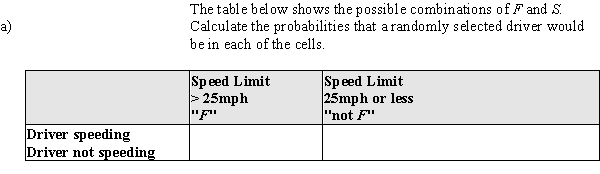 b) From the information in part (a), calculate
  .
c) From the information in part (a), calculate
.
c) From the information in part (a), calculate  .
d) From the information in part (a), calculate P(S).
e) These events are represented in a tree diagram below. What is the probability that a randomly selected driver will "follow the branches" to the X?
.
d) From the information in part (a), calculate P(S).
e) These events are represented in a tree diagram below. What is the probability that a randomly selected driver will "follow the branches" to the X? 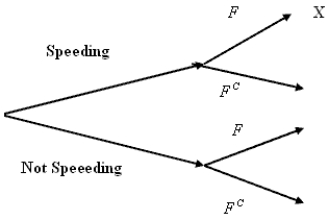
(Essay)
4.8/5 (37)
In a few sentences, distinguish between the classical and relative frequency approaches to probability.
(Essay)
4.9/5 (31)
As it gets close to time for school to start, automobiles begin to arrive on campus. Consider an experiment where a vehicle is selected at random. Define events as follows: V1 = the vehicle belongs to a school staff member V2 = the vehicle is less than 5 years old V3 = the vehicle is American made For each problem below, sketch a standard Venn diagram with 3 circles and shade the regions that correspond to the following events: a) An American vehicle less than 5 years old is selected.
b) A staff member's vehicle is selected.
c) An American made staff member's vehicle at least 5 years old is selected.
(Essay)
4.8/5 (35)
The classical view of probability is based on the Law of Large Numbers.
(True/False)
4.8/5 (30)
In a few sentences, define the following terms: a) Sample space b) Disjoint events
(Essay)
4.7/5 (35)
Black bears (Ursus americanus) have a tendency to wander for food, and they have a high level of curiosity. These characteristics will sometimes get them into trouble when they travel through human-use areas such as parks. When they become "nuisances," the Park Service transplants them if possible to other areas. The outcomes of such transplants in Glacier National Park over a 10-year period are given in the table below: 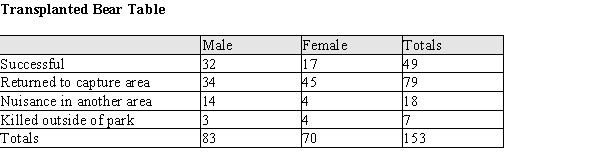 a) From these data, estimate the probability that a randomly selected transplanted bear would be male and a nuisance in another area. b) From these data, estimate the probability that a randomly selected transplanted bear would be female or successfully transplanted. c) From these data, estimate the probability that a randomly selected transplanted bear would return to the capture area if she is a female. d) After combining the above data with other National Parks, officials estimated that only about 22% of black bears in all parks become enough of a nuisance to be transplanted. They further estimate that 84% of nuisance bears are male, and fifty percent of non-nuisance bears are females. If a randomly selected bear is observed to be a male, what is the probability it will be a nuisance?
(Essay)
4.9/5 (33)
Students in two classes of upper-level mathematics were classified according to class standing and gender, resulting in the following table. 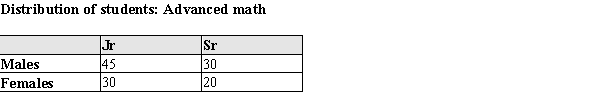 Define events A, B, and C as follows: A = the event that the selected student is a female B = the event that the selected student is a male C = the event that the selected student is a senior. In the following table indicate by putting an X in the appropriate cells which is true for each pair of events. X = Yes, Blank = No
(Essay)
4.8/5 (33)
Filters
- Essay(0)
- Multiple Choice(0)
- Short Answer(0)
- True False(0)
- Matching(0)