Exam 4: Numerical Methods for Describing Data
The % by weight of the element Lead was calculated for the coins minted in Rome. Some of the summary statistics are given in the table below. 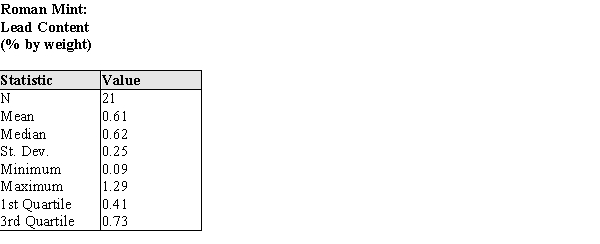 (a) Describe a procedure that uses these some or all of these summary statistics to determine whether outliers are present in the data. (b) Using your procedure from part (a), determine if there are outliers in these data.
a) Outliers are any points that are more than 1.5 interquartile ranges below the first quartile or any points that are more than 1.5 interquartile ranges above the third quartile.
b) outliers < .41−1.5(.73−.41) = −.7 outliers > .73+1.5(.73−.41) = 1.21 There are no outliers on the low end since there are no values less than −.7. However, there is at least one outlier on the high end since the maximum (1.29) is greater than the upper cutoff for outliers (1.21).
The mean is the middle value of an ordered data set.
False
An insurance agent is studying fire damage claims in a major city to see if the insurance premiums are matched to the company's risk. She takes a random sample of 20 claims, and finds the amount of each claim, in thousands of dollars. Her results are shown below: 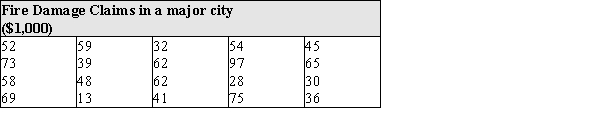 (a) Under what circumstances should one consider using a trimmed mean as a description of the center of a distribution? (b) Does the fire damage data exhibit the characteristic(s) that suggest a trimmed mean is the appropriate statistic to calculate? Explain.
a) The trimmed mean should be considered as a measure of center when the distribution is not symmetric, since the trimmed mean is more resistant than the mean.
b) No, the distribution seems symmetric so calculating the trimmed mean would be unnecessarily complicated. 5 number summary: 13, 37.5, 53, 63.5, 97 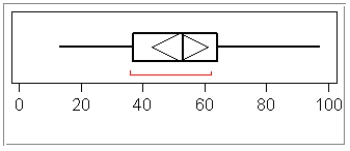
The data in the table below are from observations taken on Roman coins dating from the first three centuries AD. Historians believe that different mints might reveal themselves in different trace element profiles in the coins; these coins are known to have been minted in Rome. The technique of Atomic Absorption Spectrometry was used to estimate the % by weight of various elements in these coins; the % by weight that is gold is presented here. 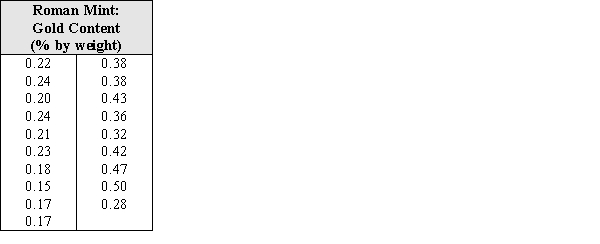 (a) Calculate these numerical summaries:
The mean _______________
The standard deviation _______________
The median _______________
The interquartile range _______________
(b) Construct a skeletal box plot for these data.
(c) Judging from the data and your responses in parts (a) and (b), would you say this distribution is skewed or approximately symmetric? Justify your response using appropriate statistical terminology.
(a) Calculate these numerical summaries:
The mean _______________
The standard deviation _______________
The median _______________
The interquartile range _______________
(b) Construct a skeletal box plot for these data.
(c) Judging from the data and your responses in parts (a) and (b), would you say this distribution is skewed or approximately symmetric? Justify your response using appropriate statistical terminology.
One disadvantage of using the mean as a measure of center for a data set is that its value is affected by the presence of even a single outlier in the data set.
A common topic of study among biologists who study social insects is colony integration, i.e. the ways members of a society interact with and influence each other. Previous research suggests that the queen of a wasp nest seems to encourage worker activity. That research is anecdotal, and quantitative information is lacking. The following data were gathered from wasp nests in California and Iowa. The nests were studied very early in their development, so each wasp could be individually identified using standard marking procedures, and their activity levels monitored reliably. The table below contains the proportions of time spent on the nest for 12 randomly selected colonies in Iowa. (The colony numbers are for identification in the table only.) There is only one queen per nest, so the proportion is for her only. The workers proportion is the average proportion for all the worker bees in the nest. 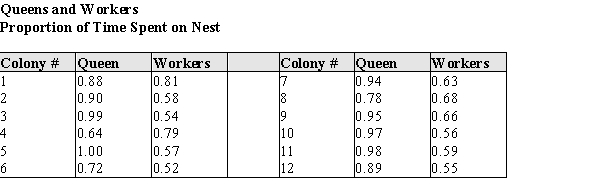 (a) Construct a comparative (back to back) stem & leaf plot of the proportions of time spent on the nest by Queens, and by Workers for these colonies.
(b) Using your plot in part (a), describe the differences and similarities in the distributions of the proportion of time spent on the nest by workers and queens.
(a) Construct a comparative (back to back) stem & leaf plot of the proportions of time spent on the nest by Queens, and by Workers for these colonies.
(b) Using your plot in part (a), describe the differences and similarities in the distributions of the proportion of time spent on the nest by workers and queens.
If there are no outliers, a skeletal and modified boxplot can differ in the length of the box, but not in the whisker lengths.
The % by weight of the element Antimony was calculated for the coins from a mint in Rome. 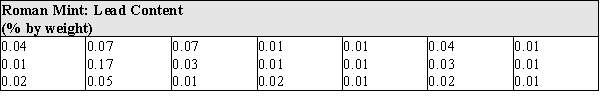 (a) Under what circumstances should one consider using a trimmed mean as a description of the center of a distribution? (b) Does the Antimony data exhibit the characteristic(s) that suggest a trimmed mean is the appropriate statistic to calculate? Explain.
The trimmed mean is less sensitive to outliers than is the mean.
By definition, an outlier is "extreme" if it is more than 3.0 iqr away from the closest quartile.
The following are the number of bottles of cola drunk by a man each month during a year.  Calculate the lower quartile, the upper quartile, and the interquartile range for the data set.
According to Chebyshev's rule, the fraction of observations that are within 3 standard deviations of the mean is at least eight-ninths.
The Empirical Rule can be used whenever the distribution of data values is reasonably well described by a normal (bell-shaped) curve.
The following are payments (in dollars) for a certain expense made by a woman during fifteen months.  Calculate the lower quartile, the upper quartile, and the interquartile range for the data set.
Mean and variance are two statistics defined for both the population and the sample. What is the difference?
Astronomers are interested in the recessional velocity of galaxies - that is, the speed at which they are moving away from the Milky Way. The accompanying table contains the recessional velocities for a sample of galaxies, measured in km/sec. Negative velocity indicates the galaxy is moving towards us. 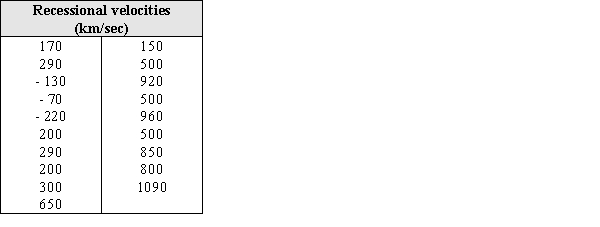
(a) Calculate these numerical summaries:
The mean _______________
The standard deviation _______________
The median _______________
The interquartile range _______________
(b) Construct a skeletal box plot for these data.
(c) Judging from the data and your responses in parts (a) and (b), would you say this distribution is skewed or approximately symmetric? Justify your response using appropriate statistical terminology.
When the histogram of a data set is closely approximated by a normal curve, the standard deviation and the interquartile range are very close to equal on average.
Filters
- Essay(0)
- Multiple Choice(0)
- Short Answer(0)
- True False(0)
- Matching(0)