Exam 5: Numerical Descriptive Measures
Exam 1: What Is Statistics16 Questions
Exam 2: Types of Data, Data Collection and Sampling17 Questions
Exam 3: Graphical Descriptive Methods Nominal Data20 Questions
Exam 4: Graphical Descriptive Techniques Numerical Data64 Questions
Exam 5: Numerical Descriptive Measures150 Questions
Exam 6: Probability112 Questions
Exam 7: Random Variables and Discrete Probability Distributions55 Questions
Exam 8: Continuous Probability Distributions118 Questions
Exam 9: Statistical Inference: Introduction8 Questions
Exam 10: Sampling Distributions68 Questions
Exam 11: Estimation: Describing a Single Population132 Questions
Exam 12: Estimation: Comparing Two Populations23 Questions
Exam 13: Hypothesis Testing: Describing a Single Population130 Questions
Exam 14: Hypothesis Testing: Comparing Two Populations81 Questions
Exam 15: Inference About Population Variances47 Questions
Exam 16: Analysis of Variance125 Questions
Exam 17: Additional Tests for Nominal Data: Chi-Squared Tests116 Questions
Exam 18: Simple Linear Regression and Correlation219 Questions
Exam 19: Multiple Regression121 Questions
Exam 20: Model Building100 Questions
Exam 21: Nonparametric Techniques136 Questions
Exam 22: Statistical Inference: Conclusion106 Questions
Exam 23: Time-Series Analysis and Forecasting146 Questions
Exam 24: Index Numbers27 Questions
Exam 25: Decision Analysis51 Questions
Select questions type
A courier company is reviewing their delivery times. The following descriptive statistics relates to this courier company. The mean time for package delivery is 5 hours, the first quartile is 4 hours, the third quartile is 17 hours. This means that 50% of deliveries take more than 5 hours?
(True/False)
4.7/5  (39)
(39)
Which of the following statements is true? A When the distribution is skewed to the left, mean > median > mode. B When the distribution is skewed to the right, mean < median < mode. C When the distribution is symmetric and unimodal, mean = median = mode. D When the distribution is symmetric and bimodal, mean = median = mode.
(Short Answer)
4.7/5 (33)
The average score for a class of 30 students was 75. The 20 male students in the class averaged 70. The female students in the class averaged: A 75 B 85 C 65 D 70 E 80
(Short Answer)
4.8/5 (37)
The coefficient of variation gives an indication of the magnitude of the standard deviation relative to the mean.
(True/False)
4.8/5 (38)
Which of the following statements best describes the mean of a data set? A The mean is a measure of spread. B The mean is a measure of central location, defined as the middle value in a sorted set of data. C he mean is a measure of central location, calculated by summing all observations in a data set divided by the number of observations in the data set. D The mean is a measure of central location, defined as the observation in a data set with the highest frequency.
(Short Answer)
4.9/5 (40)
Monthly rent data in dollars for a sample of 10 one-bedroom apartments in Perth are given below: 220 200 230 215 235 250 260 210 265 250 a. Compute the sample monthly average rent.
b. Compute the sample median.
c. What is the mode?
(Essay)
5.0/5 (28)
The following data are the heights (in cm) of the 25 students in a business statistics class: 164 148 137 157 173 156 177 172 169 165 145 168 163 162 174 152 156 168 154 151 174 146 134 140 171 a. Compute the range of the data.
b. Compute the range approximation to the standard deviation of the data. (Hint: S Range/4.)
(Essay)
4.8/5 (35)
In a symmetric distribution, the mean is the most used measure of central location for quantitative data.
(True/False)
4.8/5 (36)
The relative frequency histogram for the age (in years) of a sample of 25 employees from a government department, is given below. 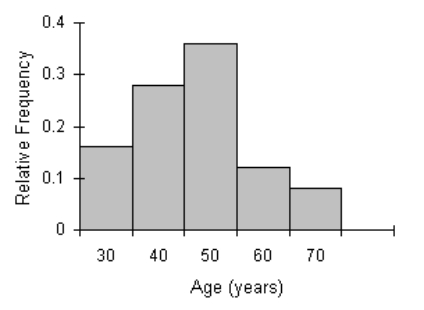 Explain what the best measure of variability is.
(Essay)
4.9/5 (40)
The following data represent the ages (in years) of a sample of 25 employees from a government
department: 31 43 56 23 49 42 33 61 44 28 48 38 44 35 40 64 52 42 47 39 53 27 36 35 20 Find the coefficient of variation.
(Essay)
4.8/5 (28)
The following data represent the weights (in kilograms) of a sample of 30 horses: Weight
165 175 150 155 173 149 145 153 153 153 152 145 164 143 170 175 148 174 171 156 166 168 152 150 173 168 146 155 172 159 Determine the location and value of the upper quartile of the weights.
(Essay)
4.9/5 (32)
A basketball player has the following points for seven games: 20, 25, 32, 18, 19, 22, 30. Compute the following measures of central location and variability:
a. mean.
b. median.
c. standard deviation.
d. coefficient of variation.
(Essay)
4.9/5 (27)
If the coefficient of correlation r = +1, then the best-fit linear equation will actually be satisfied by all of the data points.
(True/False)
5.0/5 (31)
The following data represent the ages (in years) of a sample of 25 employees from a government
department: 31 43 56 23 49 42 33 61 44 28 48 38 44 35 40 64 52 42 47 39 53 27 36 35 20 Compute the sample variance and sample standard deviation.
(Essay)
4.9/5 (31)
The following data represent the salaries (in thousands of dollars) of a sample of 13 employees of a firm: 26.5 23.5 29.7 24.8 21.1 24.3 20.4 22.7 27.2 23.7 24.1 24.8 28.2 Compute the 90th percentile.
(Essay)
4.8/5 (43)
The following data represent the salaries (in thousands of dollars) of a sample of 13 employees of a firm: 26.5 23.5 29.7 24.8 21.1 24.3 20.4 22.7 27.2 23.7 24.1 24.8 28.2 Compute the range.
(Short Answer)
4.8/5 (31)
Chebyshev's theorem applies only to data sets that have a mound-shaped distribution.
(True/False)
4.7/5 (30)
The following data represent the salaries (in thousands of dollars) of a sample of 13 employees of a firm: 26.5 23.5 29.7 24.8 21.1 24.3 20.4 22.7 27.2 23.7 24.1 24.8 28.2 Consider the following population of measurements: 162 152 177 157 184 176 165 181 170 163 a. Compute the mean.
b. Compute the median.
c. Compute the variance and the standard deviation.
(Essay)
4.9/5 (35)
Filters
- Essay(0)
- Multiple Choice(0)
- Short Answer(0)
- True False(0)
- Matching(0)