Exam 5: Numerical Descriptive Measures
Exam 1: What Is Statistics16 Questions
Exam 2: Types of Data, Data Collection and Sampling17 Questions
Exam 3: Graphical Descriptive Methods Nominal Data20 Questions
Exam 4: Graphical Descriptive Techniques Numerical Data64 Questions
Exam 5: Numerical Descriptive Measures150 Questions
Exam 6: Probability112 Questions
Exam 7: Random Variables and Discrete Probability Distributions55 Questions
Exam 8: Continuous Probability Distributions118 Questions
Exam 9: Statistical Inference: Introduction8 Questions
Exam 10: Sampling Distributions68 Questions
Exam 11: Estimation: Describing a Single Population132 Questions
Exam 12: Estimation: Comparing Two Populations23 Questions
Exam 13: Hypothesis Testing: Describing a Single Population130 Questions
Exam 14: Hypothesis Testing: Comparing Two Populations81 Questions
Exam 15: Inference About Population Variances47 Questions
Exam 16: Analysis of Variance125 Questions
Exam 17: Additional Tests for Nominal Data: Chi-Squared Tests116 Questions
Exam 18: Simple Linear Regression and Correlation219 Questions
Exam 19: Multiple Regression121 Questions
Exam 20: Model Building100 Questions
Exam 21: Nonparametric Techniques136 Questions
Exam 22: Statistical Inference: Conclusion106 Questions
Exam 23: Time-Series Analysis and Forecasting146 Questions
Exam 24: Index Numbers27 Questions
Exam 25: Decision Analysis51 Questions
Select questions type
A linear regression model estimating the relationship between Expenditure on imports($) and Annual household income($) is as follows:
Estimated Expenditure on Imports = 1.35 + 0.11Annual household income.
Interpret the slope.
(Essay)
4.8/5  (37)
(37)
When approximating descriptive measures for grouped data, the shape of the distribution within each class is ignored.
(True/False)
4.7/5 (45)
When is the standard deviation of a data set smaller than its variance? Explain.
(Essay)
4.9/5 (40)
The mean of fifty sales receipts is $65.75 and the standard deviation is $10.55. Using Chebyshev's theorem, at least 75% of the sales receipts were between $44.65 and $86.85.
(True/False)
4.8/5 (38)
Which of the following statements is true? A When approximating the sample mean for grouped data we assume that the midpoint of each class closely approximates the mean of observations in the class. B When approximating the sample mean for grouped data we cannot assume that the midpoin of each class closely approximates the mean of observations in the class. C Descriptive measures for grouped data are not possible. D None of these choices are correct.
(Short Answer)
4.8/5 (43)
The annual percentage rates of return over the past 10 years for two mutual funds are as follows: Fund A: 7.1 -7.4 19.7 -3.9 32.4 41.7 23.2 4.0 1.9 29.3 Fund B: 10.8 -4.1 5.1 10.9 26.5 24.0 16.9 9.4 -2.6 10.1 Which fund would you classify as having the higher level of risk?
(Essay)
4.7/5 (37)
The coefficient of correlation indicates the direction and the strength of the linear relationship between two variables.
(True/False)
4.8/5 (38)
The following data are the heights (in cm) of the 25 students in a business statistics class: 164 148 137 157 173 156 177 172 169 165 145 168 163 162 174 152 156 168 154 151 174 146 134 140 171 a. Compute the sample mean height.
b. Compute the sample variance.
c. Compute the sample standard deviation.
(Essay)
4.9/5 (38)
A linear regression model estimating the relationship between Expenditure on Imports and Annual household income has an r2 value of 0.81.
Interpret r2.
(Essay)
4.7/5 (41)
The coefficient of correlation is the covariance divided by the standard deviation
(True/False)
4.7/5 (36)
How is the value of the correlation coefficient r affected in each of the following cases?
a. Each x value is multiplied by 4.
b. Each x value is switched with the corresponding y value.
c. Each x value is increased by 2.
(Essay)
4.8/5 (42)
The following data represent the ages (in years) of a sample of 25 employees from a government
department: 31 43 56 23 49 42 33 61 44 28 48 38 44 35 40 64 52 42 47 39 53 27 36 35 20 Compute the range approximation to the standard deviation of the data. (Hint: S Range/4)
(Essay)
4.8/5 (36)
Data from three samples are shown below: Sample A: 17 22 20 18 23 Sample B: 30 28 35 40 25 Sample C: 44 39 54 21 52 Examine the three samples. Without performing any calculations, indicate which sample has the greatest amount of variability and which sample has the least amount of variability.
(Essay)
4.9/5 (34)
The mean of a sample of 15 measurements is 35.6. Suppose that the sample is enlarged to 16 measurements, by including one additional measurement having a value of 42. Find the mean of the sample of 16 measurements.
(Short Answer)
4.9/5 (37)
A sample of 12 measurements has a mean of 25 and a standard deviation of 4. Suppose that the sample is enlarged to 14 measurements, by including two additional measurements having a common value of 25.
a. Find the mean of the sample of 14 measurements.
b. Find the standard deviation of the sample of 14 measurements.
(Essay)
4.9/5 (30)
A student scores 87, 73, 92 and 86 on four exams during the semester, and 95 on the final exam. If the final is weighted double and the four others weighted equally, the student's final average would be 88.
(True/False)
4.9/5 (45)
The frequency histogram for the heights (in cm) of the 25 students in a business statistics class is given below. 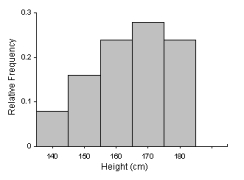 What is the best measure of variability?
(Essay)
4.7/5 (40)
The following data represent the salaries (in thousands of dollars) of a sample of 13 employees of a firm: 26.5 23.5 29.7 24.8 21.1 24.3 20.4 22.7 27.2 23.7 24.1 24.8 28.2 Compute the coefficient of variation.
(Essay)
4.7/5 (35)
The coefficient of variation is the standard deviation divided by the mean.
(True/False)
4.8/5 (35)
Filters
- Essay(0)
- Multiple Choice(0)
- Short Answer(0)
- True False(0)
- Matching(0)