Exam 5: Numerical Descriptive Measures
Exam 1: What Is Statistics16 Questions
Exam 2: Types of Data, Data Collection and Sampling17 Questions
Exam 3: Graphical Descriptive Methods Nominal Data20 Questions
Exam 4: Graphical Descriptive Techniques Numerical Data64 Questions
Exam 5: Numerical Descriptive Measures150 Questions
Exam 6: Probability112 Questions
Exam 7: Random Variables and Discrete Probability Distributions55 Questions
Exam 8: Continuous Probability Distributions118 Questions
Exam 9: Statistical Inference: Introduction8 Questions
Exam 10: Sampling Distributions68 Questions
Exam 11: Estimation: Describing a Single Population132 Questions
Exam 12: Estimation: Comparing Two Populations23 Questions
Exam 13: Hypothesis Testing: Describing a Single Population130 Questions
Exam 14: Hypothesis Testing: Comparing Two Populations81 Questions
Exam 15: Inference About Population Variances47 Questions
Exam 16: Analysis of Variance125 Questions
Exam 17: Additional Tests for Nominal Data: Chi-Squared Tests116 Questions
Exam 18: Simple Linear Regression and Correlation219 Questions
Exam 19: Multiple Regression121 Questions
Exam 20: Model Building100 Questions
Exam 21: Nonparametric Techniques136 Questions
Exam 22: Statistical Inference: Conclusion106 Questions
Exam 23: Time-Series Analysis and Forecasting146 Questions
Exam 24: Index Numbers27 Questions
Exam 25: Decision Analysis51 Questions
Select questions type
The difference between the largest and smallest values in an ordered array is called the range.
(True/False)
4.9/5  (30)
(30)
A media article claimed that there was a correlation between the colour of a car and the likelihood of a car being in an accident. What is wrong with this statement?
(Essay)
5.0/5 (33)
A courier company is reviewing their delivery times. The following descriptive statistics relates to this courier company. The mean time for package delivery is 5 hours, the first quartile is 4 hours, the third quartile is 17 hours. This means that the median must lie between 4 hours and 17 hours.
(True/False)
4.8/5 (43)
The value of the standard deviation may be either positive or negative, while the value of the variance will always be positive.
(True/False)
4.8/5 (39)
A linear regression model estimating the relationship between Expenditure on exports ($) and Annual household income ($) is as follows:
Estimated Expenditure on Exports = 3.55 − 0.02Annual household income
Interpret the slope.
(Essay)
4.8/5 (39)
The frequency histogram for the heights (in cm) of the 25 students in a business statistics class is given below. 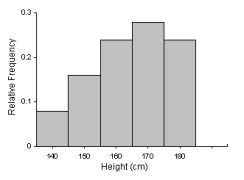 What is the best measure of central location?
(Essay)
4.7/5 (42)
Which of the following summary measures cannot be easily approximated from a box-and-whisker plot? A The range. B The interquartile range. C The second quartile. D The standard deviation. E All of these choices are correct.
(Short Answer)
4.9/5 (48)
Which of the following may be answered by knowing the shape of the distribution? A What is the best measure of central location to use. B What is the best measure of variability to use. C What the best measure of central location and variability to use. D None of these choices are correct.
(Short Answer)
4.9/5 (34)
The interquartile range is found by taking the difference between the 1st and 3rd quartiles and dividing that value by 2.
(True/False)
4.8/5 (37)
Is the following histogram constructed from the weight data unimodal, bimodal or multimodal? 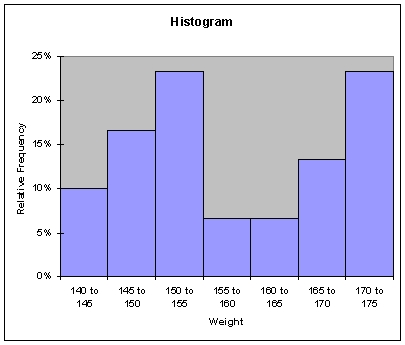
(Essay)
4.8/5 (31)
Filters
- Essay(0)
- Multiple Choice(0)
- Short Answer(0)
- True False(0)
- Matching(0)