Exam 16: Time Series and Forecasting
Exam 1: What Is Statistics78 Questions
Exam 2: Describing Data: Frequency Distributions and Graphic Presentation101 Questions
Exam 3: Describing Data: Numerical Measures186 Questions
Exam 4: A Survey of Probability Concepts121 Questions
Exam 5: Discrete Probability Distributions111 Questions
Exam 6: The Normal Probability Distribution129 Questions
Exam 7: Sampling Methods and the Central Limit Theorem78 Questions
Exam 8: Estimation and Confidence Intervals128 Questions
Exam 9: One-Sample Tests of a Hypothesis223 Questions
Exam 10: Two-Sample Tests of Hypothesis87 Questions
Exam 11: Analysis of Variance80 Questions
Exam 12: Linear Regression and Correlation150 Questions
Exam 13: Multiple Regression and Correlation Analysis98 Questions
Exam 14: Chi-Square Applications for Nominal Data113 Questions
Exam 15: Index Numbers65 Questions
Exam 16: Time Series and Forecasting86 Questions
Exam 17: An Introduction to Decision Theory37 Questions
Select questions type
i. Long-term forecasts are usually from one year to more than 10 years into the future.
ii. A forecast is considered necessary in order to have the raw materials, production facilities, and staff available to meet estimated future demands.
Iii) Many business and economic time series have a recurring seasonal pattern.
(Multiple Choice)
4.9/5  (33)
(33)
Listed below is the net sales in $ million for Home Depot Inc., and its subsidiaries from 1994 to 2003. 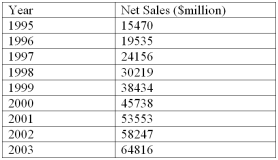 Using the printout below, what are the estimated sales for 2007?
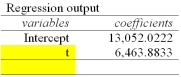
(Multiple Choice)
4.8/5 (41)
If you have annual data for 1991 to 2002 and want to code the years for the calculation of the trend, what should you code the year 1991?
(Multiple Choice)
4.8/5 (30)
What is the correct order of events in a typical business cycle?
(Multiple Choice)
4.8/5 (37)
i. A time series is a collection of data recorded over a period of time, usually monthly, quarterly, or yearly.
Ii) Episodic and residual variations can be projected into the future.
Iii) A forecast is considered necessary in order to have the raw materials, production facilities, and staff available to meet estimated future demands.
(Multiple Choice)
4.8/5 (32)
The events on Sept 11, 2001 exerted an impact on the economy that could be classified as:
(Multiple Choice)
4.9/5 (35)
i. In the final step, using the ratio-to-moving-average method on quarterly data, the total of the modified means should theoretically be equal to 400 because the average of should be 100.
ii. Seasonal variation is quite common in the retail and wholesale industries.
iii. A typical seasonal index of 103.7 for January indicates that sales for January are below the annual average)
(Multiple Choice)
4.8/5 (22)
A plastics manufacturing performed a quarterly time series analysis for demands over the last five years (periods 1 through 20). The analysis resulted in the following trend equation and seasonal indexes:  = 920.0 + 22.6 t
 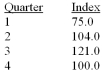 Using the trend line question and the seasonal indexes, predict demand for the third period of the next year, i.e., period 23.
(Multiple Choice)
4.8/5 (32)
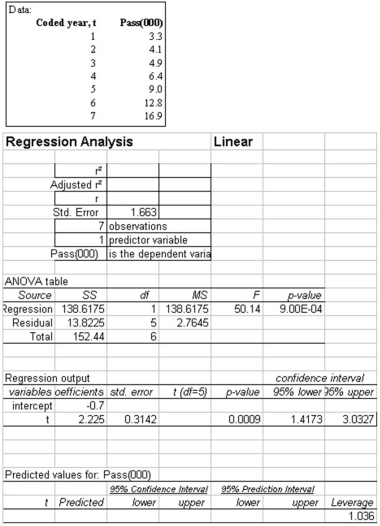 If the data appears to be increasing exponentially and we wish to forecast number of passengers for year 9, we can use Log10 and linear regression equation. What is the linear equation for Log10 of this data?
(Multiple Choice)
4.9/5 (41)
i. In the linear trend equation, t is any value that corresponds with a time period, i.e., month or quarter.
ii. A straight-line trend equation is used to represent the time series when it is believed that the data is increasing (or decreasing) by equal amounts, on the average, from one period to another.
Iii) If the past data approximates a straight line, the equation used is  = a + bt, where a is the y- intercept and b is the slope of the line.
(Multiple Choice)
4.7/5 (49)
i. The reason for deseasonalizing a sales series is to remove trend and cyclical fluctuations so that we can study seasonal fluctuations.
Ii) Using the ratio-to-moving-average method, dividing the actual sales for a month by the typical seasonal for that month results in a figure that includes only trend, cycle and irregular fluctuations. This procedure is called deseasonalizing the sales.
Iii) Knowing the seasonal pattern in the form of indexes allows the retailer to deseasonalize sales. This is accomplished by dividing the actual sales for a month by the typical index for that month.
(Multiple Choice)
4.9/5 (30)
Teton Village contains shops, restaurants and motels. They have two peak seasons, - winter for skiing, and summer, for tourists visiting nearby parks. The specific seasonal with respect to the total sales volume for recent years are: 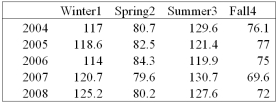 Using the seasonal indexes below, explain the typical index for the spring season.
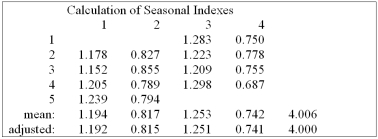
(Multiple Choice)
4.7/5 (33)
Given a linear time series trend, = - 5.2 + 3.1t, what is the forecast for 2002 if the t = 0 in 1994?
(Multiple Choice)
5.0/5 (36)
The following linear trend equation was developed for the annual sales of the Jordan Manufacturing Company. ŷ = 500 + 60t ($000). How much are sales increasing?
(Multiple Choice)
4.7/5 (36)
A plastics manufacturing performed a quarterly time series analysis for demands over the last five years (periods 1 through 20). The analysis resulted in the following trend equation and seasonal indexes:  = 920.0 + 22.6 t
 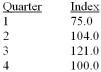 Based on the seasonal indexes, which quarter is expect to have 25% less demand than predicted by the trend line?
(Multiple Choice)
4.9/5 (26)
The Westberg Electric Company sells electric motors. The monthly trend equation, based on four years of monthly data, is Y' = 4.4 + 0.5t. The seasonal factor for the month of June is 105. Determine the seasonally adjusted forecast for June of the fifth year.
(Multiple Choice)
4.9/5 (36)
Since a ski resort does most of its business in the winter, what is the major source of variation in income due to?
(Multiple Choice)
4.8/5 (38)
Filters
- Essay(0)
- Multiple Choice(0)
- Short Answer(0)
- True False(0)
- Matching(0)