Exam 16: Time Series and Forecasting
Exam 1: What Is Statistics78 Questions
Exam 2: Describing Data: Frequency Distributions and Graphic Presentation101 Questions
Exam 3: Describing Data: Numerical Measures186 Questions
Exam 4: A Survey of Probability Concepts121 Questions
Exam 5: Discrete Probability Distributions111 Questions
Exam 6: The Normal Probability Distribution129 Questions
Exam 7: Sampling Methods and the Central Limit Theorem78 Questions
Exam 8: Estimation and Confidence Intervals128 Questions
Exam 9: One-Sample Tests of a Hypothesis223 Questions
Exam 10: Two-Sample Tests of Hypothesis87 Questions
Exam 11: Analysis of Variance80 Questions
Exam 12: Linear Regression and Correlation150 Questions
Exam 13: Multiple Regression and Correlation Analysis98 Questions
Exam 14: Chi-Square Applications for Nominal Data113 Questions
Exam 15: Index Numbers65 Questions
Exam 16: Time Series and Forecasting86 Questions
Exam 17: An Introduction to Decision Theory37 Questions
Select questions type
i. In the linear trend equation, t is any value that corresponds with a time period, i.e., month or quarter.
ii. The least squares method of computing the equation for a straight line going through the data of interest gives the "best fitting" line.
Iii) If the sales, production or other data over a period of time tend to approximate a straight-line
Trend, the equation developed by the least squares method cannot be used to forecast sales for a future period.
(Multiple Choice)
5.0/5  (36)
(36)
Which one of the following is not a component of a time series?
(Multiple Choice)
4.9/5 (30)
i. Using the ratio-to-moving-average method, dividing the actual sales for a month by the typical seasonal for that month results in a figure that includes only trend, cycle and irregular fluctuations. This procedure is called deseasonalizing the sales.
Ii) The reason for deseasonalizing a sales series is to remove trend and cyclical fluctuations so that we can study seasonal fluctuations.
Iii) Knowing the seasonal pattern in the form of indexes allows the retailer to deseasonalize sales.
(Multiple Choice)
4.9/5 (27)
How will data which increases (or decreases) by equal percents appear when plotted on graph paper having an arithmetic scale?
(Multiple Choice)
4.9/5 (39)
Listed below is the net sales in $ million for Home Depot Inc., and its subsidiaries from 1994 to 2003. 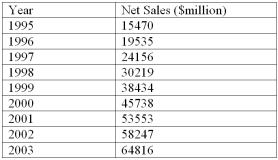 Using the printout below, what are the estimated sales for 2005?
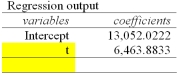
(Multiple Choice)
4.8/5 (37)
The Westberg Electric Company sells electric motors. The monthly trend equation, based on four years of monthly data, is Y' = 4.4 + 0.5t. The seasonal factor for the month of May is 85. Determine the seasonally adjusted forecast for April of the fifth year.
(Multiple Choice)
4.8/5 (37)
The Westberg Electric Company sells electric motors. The monthly trend equation, based on four years of monthly data, is Y' = 4.4 + 0.5t. The seasonal factor for the month of March is 100. Determine the seasonally adjusted forecast for March of the fifth year.
(Multiple Choice)
4.8/5 (39)
i. In a time series analysis, the letter "a" in the linear trend equation, is the value of  when t = 0.
ii. In the linear trend equation, t is any value that corresponds with a time period, i.e., month or quarter.
Iii) If the sales, production or other data over a period of time tend to approximate a straight-line
Trend, the equation developed by the least squares method cannot be used to forecast sales for a future period.
when t = 0.
ii. In the linear trend equation, t is any value that corresponds with a time period, i.e., month or quarter.
Iii) If the sales, production or other data over a period of time tend to approximate a straight-line
Trend, the equation developed by the least squares method cannot be used to forecast sales for a future period.
(Multiple Choice)
4.9/5 (42)
What is variation within a year, such as high sales at Christmas and Easter and low sales in January, called?
(Multiple Choice)
4.8/5 (28)
The table below shows the sales for a plastics manufacturer recorded over the past year. The seasonal indexes for each quarter are also provided). To track the trend for these four quarters, use the indexes to deseasonalize the sales data) 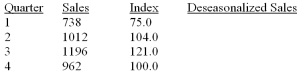 What are deseasonalized sales for quarter 1?
(Multiple Choice)
4.9/5 (33)
In the calculation of 4-quarter seasonal indices the total of the quarterly means will be:
(Multiple Choice)
4.9/5 (34)
i. One component of a time series is the secular trend that is the smooth movement of a series over a short period of time, such as a few months or quarters.
ii. Many business and economic time series have a recurring seasonal pattern.
Iii) One component of a time series is cyclical variation. An example of cyclical variation is the business cycle that consists of periods of prosperity followed by periods of recession, depression, and recovery.
(Multiple Choice)
4.8/5 (45)
The merchants in Morris, Manitoba suffered flood damage in May 1997. Stores were closed for remodeling nearly two months. What is this type of variation in sales called?
(Multiple Choice)
4.8/5 (33)
For a three-year moving average, how many values will be lost at the beginning and end of the time series?
(Multiple Choice)
4.9/5 (38)
The Westberg Electric Company sells electric motors. The monthly trend equation, based on four years of monthly data, is Y' = 4.4 + 0.5t. The seasonal factor for the month of April is 98. Determine the seasonally adjusted forecast for April of the fifth year.
(Multiple Choice)
4.8/5 (45)
For an annual time series extending from 1993 through 2001, how many years would be lost in a five- year moving average?
(Multiple Choice)
4.9/5 (37)
Listed below is the net sales in $ million for Home Depot Inc., and its subsidiaries from 1994 to 2003. 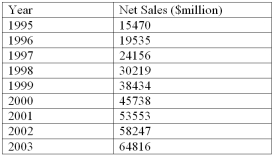 Using the printout below, what are the estimated sales for 2010?
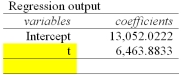
(Multiple Choice)
4.9/5 (43)
Filters
- Essay(0)
- Multiple Choice(0)
- Short Answer(0)
- True False(0)
- Matching(0)