Exam 16: Time Series and Forecasting
Exam 1: What Is Statistics78 Questions
Exam 2: Describing Data: Frequency Distributions and Graphic Presentation101 Questions
Exam 3: Describing Data: Numerical Measures186 Questions
Exam 4: A Survey of Probability Concepts121 Questions
Exam 5: Discrete Probability Distributions111 Questions
Exam 6: The Normal Probability Distribution129 Questions
Exam 7: Sampling Methods and the Central Limit Theorem78 Questions
Exam 8: Estimation and Confidence Intervals128 Questions
Exam 9: One-Sample Tests of a Hypothesis223 Questions
Exam 10: Two-Sample Tests of Hypothesis87 Questions
Exam 11: Analysis of Variance80 Questions
Exam 12: Linear Regression and Correlation150 Questions
Exam 13: Multiple Regression and Correlation Analysis98 Questions
Exam 14: Chi-Square Applications for Nominal Data113 Questions
Exam 15: Index Numbers65 Questions
Exam 16: Time Series and Forecasting86 Questions
Exam 17: An Introduction to Decision Theory37 Questions
Select questions type
i. A typical monthly seasonal index of 107.0 indicates that sales (or whatever the variable is) are 7 percent above the annual average).
ii. Seasonal variation is quite common in the retail and wholesale industries.t6
iii. A typical seasonal index of 103.7 for January indicates that sales for January are below the annual average)
(Multiple Choice)
4.7/5  (26)
(26)
The following linear trend equation was developed for annual sales from 1995 to 2001 with 1995 the base or zero year. ŷ = 500 + 60t ($000). What are the estimated sales for 2005 ($000)?
(Multiple Choice)
4.9/5 (37)
Which of the following is true for the exponential equation?
(Multiple Choice)
4.9/5 (41)
Listed below is the net sales in $ million for Home Depot Inc., and its subsidiaries from 1994 to 2003. 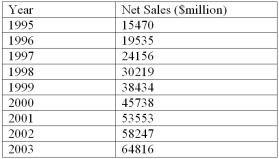 Using the printout below, what are the estimated sales for 2011?
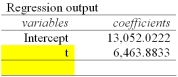
(Multiple Choice)
4.9/5 (43)
What is the general equation for the logarithmic trend equation is log =:
(Multiple Choice)
4.7/5 (32)
i. If the sales, production or other data over a period of time tend to approximate a straight-line trend, the equation developed by the least squares method cannot be used to forecast sales for a future period.
Ii) A straight-line trend equation is used to represent the time series when it is believed that the data is increasing (or decreasing) by equal amounts, on the average, from one period to another.
Iii) If the past data approximates a straight line, the equation used is  = a + bt, where a is the y- intercept and b is the slope of the line.
(Multiple Choice)
4.8/5 (35)
Filters
- Essay(0)
- Multiple Choice(0)
- Short Answer(0)
- True False(0)
- Matching(0)