Exam 10: Correlation and Regression
Exam 1: Introduction to Statistics60 Questions
Exam 2: Exploring Data With Tables and Graphs60 Questions
Exam 3: Describing, Exploring, and Comparing Data60 Questions
Exam 4: Probability60 Questions
Exam 5: Discrete Probability Distributions60 Questions
Exam 6: Normal Probability Distributions60 Questions
Exam 7: Estimating Parameters and Determining Sample Sizes60 Questions
Exam 8: Hypothesis Testing60 Questions
Exam 9: Inferences From Two Samples60 Questions
Exam 10: Correlation and Regression60 Questions
Exam 11: Goodness-Of-Fit and Contingency Tables60 Questions
Exam 12: Analysis of Variance59 Questions
Exam 13: Nonparametric Tests60 Questions
Exam 14: Statistical Process Control60 Questions
Select questions type
Suppose there is significant correlation between two variables. Describe two cases under which it might be inappropriate to use the linear regression equation for prediction. Give
examples to support these cases.
(Essay)
4.8/5  (36)
(36)
The residual is the difference between the ______ and the ________.
(Multiple Choice)
4.9/5 (38)
For the data below, determine the value of the linear correlation coefficient r between y and
1.2 2.7 4.4 6.6 9.5 1.6 4.7 9.9 24.5 39.0
(Multiple Choice)
4.8/5 (25)
Find the value of the linear correlation coefficient r. The paired data below consist of the costs of advertising (in thousands of dollars)and the number of products sold (in thousands). Cost 9 2 3 4 2 5 9 10 Number 85 52 55 68 67 86 83 73
(Multiple Choice)
4.7/5 (37)
Sketch a sample scatterplot of at least 5 points that would have a linear correlation coefficient equal to −1.
(Essay)
4.8/5 (33)
Suppose you will perform a test to determine whether there is sufficient evidence to support a claim of a linear correlation between two variables. Find the critical value(s) of r given that n=10 and
(Multiple Choice)
4.7/5 (33)
Use computer software to find the best multiple regression equation to explain the variation in the dependent variable, Y, in terms of the independent variables, Y 456 9896 29.1 1 421 9680 42.3 2 653 10449 29.8 3 573 10811 26.0 4 CORRELATION COEFFICIENTS 546 10014 34.3 5 499 10293 22.7 6 Y/=0.509 504 9413 24.2 7 Y/=0.280 611 9860 31.6 8 Y/=0.930 646 9782 25.6 9 789 12139 37.9 10 COEFFICIENTS OF DETERMINATION 773 12166 33.9 11 753 9976 37.4 12 Y/=0.259 852 10645 27.0 13 Y/=0.079 755 9738 31.5 14 Y/=0.864 815 9933 39.9 15 Y/,=0.880 902 10132 25.3 16 Y/,,=0.884 986 11145 30.4 17 909 9775 32.7 18 945 9549 35.0 19 866 10077 33.8 20 1178 11550 29.4 21 1230 10600 37.1 22 1207 11280 42.9 23 968 12100 32.2 24 1118 12420 30.5 25 Productivity ( ) 23 25 28 21 21 25 26 30 34 36 Dexterity ( ) 49 53 59 42 47 53 55 63 67 75
(Multiple Choice)
4.9/5 (34)
Use computer software to obtain the multiple regression equation and identify adjusted R and the P -value. An anti-smoking group used data in the table to relate the carbon monoxid (CO) of various brands of cigarettes to their tar and nicotine (NIC) content.
CO TAR NIC 15 1.2 16 15 1.2 16 17 1.0 16 6 0.8 9 1 0.1 1 8 0.8 8 10 0.8 10 17 1.0 16 15 1.2 15 11 0.7 9 18 1.4 18 16 1.0 15 10 0.8 9 7 0.5 5 18 1.1 16
(Multiple Choice)
4.8/5 (28)
Applicants for a particular job, which involves extensive travel in Spanish speaking countries must take a proficiency test in Spanish. The sample data below were obtained in a study of the relationship between the numbers of years applicants have studied Spanish (x) and their score on the test (y) .
x 3 4 4 2 5 3 4 5 3 2 y 57 78 72 58 89 63 73 84 75 48
The regression equation was obtained. Construct a residual plot for the data.
(Essay)
4.8/5 (36)
Use computer software to find the best multiple regression equation to explain the variation in the dependent variable, Y, in terms of the independent variables,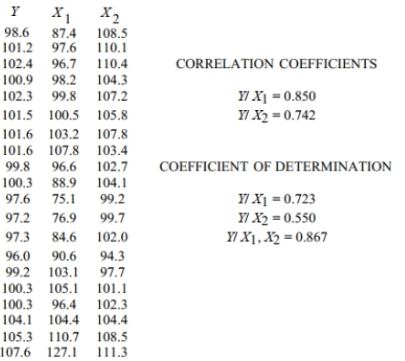
(Multiple Choice)
4.9/5 (33)
Give an example of a pair of variables whose linear correlation coefficient is likely to be close to zero.
(Essay)
4.7/5 (39)
Provide an appropriate response. For the data below, determine the logarithmic equation, y=a+b ln x that best fits the data. Hint: Begin by replacing each x -value with ln x then use the usual methods to find the equation of the least squares regression line.
x 1.2 2.7 4.4 6.6 9.5 y 1.6 4.7 8.9 9.5 12.0
(Multiple Choice)
4.8/5 (26)
Describe the standard error of estimate, How do smaller values of relate to the dispersion of data points about the line determined by the linear regression equation? What does it mean when is 0 ?
(Essay)
4.9/5 (40)
Find the coefficient of determination, given that the value of the linear correlation coefficient, r, is 0.738.
(Multiple Choice)
4.9/5 (38)
The table below shows the population of a city (in millions) in each year during the period 2010-2015. Using the number of years since 2010 as the independent variable, find the regression equation of the best model. Assume that the model is to be used only for the scope of the given data, and consider only linear, quadratic, logarithmic, exponential, and power models. Include the type of model and the equation for the model you find.
Year 2010 2011 2012 2013 2014 2015 Population(millions) 1.08 1.37 1.68 2.19 2.73 3.34
(Essay)
4.9/5 (39)
Given the linear correlation coefficient r and the sample size n, determine the critical values of r and use your finding to state whether or not the given r represents a significant linear correlation. Use a significance level of 0.05 .
r=0.767, n=25
(Multiple Choice)
4.9/5 (35)
Below are the productivity, dexterity, and job satisfaction ratings of ten randomly selected employees.
Productivity ( ) 23 25 28 21 21 25 26 30 34 36 Dexterity ( ) 43 53 59 42 47 53 55 63 67 75 Satisfaction ( ) 56 58 60 50 54 61 59 63 67 69
Find the multiple regression equation that expresses the job satisfaction scores in terms of the productivity and dexterity scores.
(Multiple Choice)
4.9/5 (28)
A 0.05 significance level is being used to test a correlation between two variables. If the linear correlation coefficient r is found to be 0.591 and the critical values are what can you conclude?
(Multiple Choice)
4.9/5 (36)
Based on the scatterplot, select the most likely value of the linear correlation coefficient r 
(Multiple Choice)
4.9/5 (40)
Filters
- Essay(0)
- Multiple Choice(0)
- Short Answer(0)
- True False(0)
- Matching(0)