Exam 12: Statistical Control Charts, Nonparametric Tests, and Hypothesis Testing
Exam 1: Introduction to Statistics59 Questions
Exam 2: Exploring Data With Tables and Graphs59 Questions
Exam 3: Describing, Exploring, and Comparing Data59 Questions
Exam 4: Probability60 Questions
Exam 5: Discrete Probability Distributions59 Questions
Exam 6: Normal Probability Distributions60 Questions
Exam 7: Estimating Parameters and Determining Sample Sizes58 Questions
Exam 8: Hypothesis Testing57 Questions
Exam 9: Inferences From Two Samples58 Questions
Exam 10: Correlation and Regression56 Questions
Exam 11: Chi-Square and Analysis of Variance60 Questions
Exam 12: Statistical Control Charts, Nonparametric Tests, and Hypothesis Testing181 Questions
Select questions type
Provide the appropriate response. Describe the Wilcoxon signed-ranks test. What types of_
hypotheses is it used to test? What assumptions are made for this test?
(Essay)
4.8/5  (29)
(29)
Examine the given run chart or control chart and determine whether the process is within
statistical control. If it is not, identity which of the three out-of-statistical-control criteria
apply. A run chart for individual values W is shown below. Does there appear to be a pattern
suggesting that the process is not within statistical control? If so, describe the pattern. 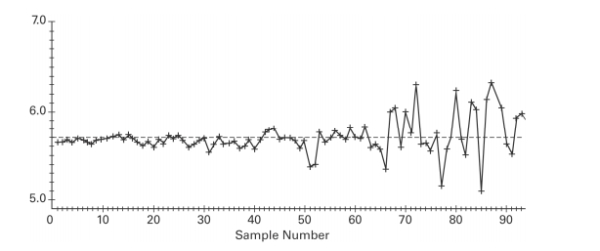
(Essay)
4.8/5 (34)
Given below are the analysis of variance results from a Minitab display._ to use a 0.05 significance level in testing the null hypothesis that the different samples come
From populations with the same mean. Identify the p-value. Source Factor 3 30 10.00 1.6 0.264 Error 8 50 6.25 Total 11 80
(Multiple Choice)
4.7/5 (32)
A control chart for is shown below._
statistical control. If it is not, identify which of the three out-of-control criteria lead to rejection
of a statistically stable mean. 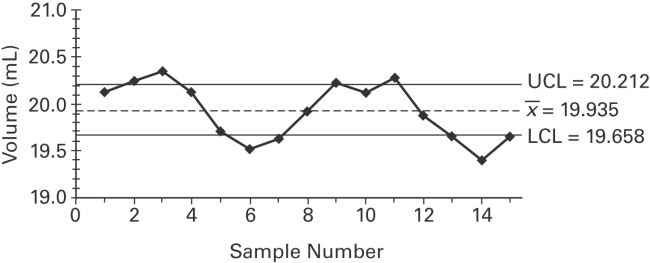
(Essay)
4.9/5 (31)
Suppose you are to test for equality of four different population means, with Write the hypotheses for the paired tests. Use methods of
probability to explain why the process of ANOVA has a higher degree of confidence than
testing each of the pairs separately.
(Essay)
4.9/5 (30)
A control chart for is shown below. Determine whether the process mean is within_
statistical control. If it is not, identify which of the three out-of-control criteria lead to
rejection of a statistically stable mean. 
(Essay)
4.8/5 (34)
The following data shows the yield, in bushels per acre, categorized according to three
varieties of corn and three different soil conditions. Assume that yields are not affected by an
interaction between variety and soil conditions, and test the null hypothesis that variety has no
effect on yield. Use a 0.05 significance level. Plot 1 Plot 2 Plot Variety 1 156,167, 162,160, 145,151, 170,162 169,168 148,155 Variety 2 172,176, 179,186, 161,162, 166,179 160,176 165,170 Variety 3 175,157, 178,170, 169,165, 179,178 172,174 170,169
(Essay)
4.8/5 (27)
List the assumptions for testing hypotheses that three or more means are equivalent._
(Essay)
4.8/5 (34)
Do parametric or nonparametric tests have higher efficiency ratings?
(Multiple Choice)
4.9/5 (25)
Suppose you are to test for equality of four different population means, with_ . Write the hypotheses for the paired tests. Use methods of
probability to explain why the process of ANOVA has a higher degree of confidence than
testing each of the pairs separately.
(Essay)
4.8/5 (28)
Describe the Wilcoxon rank-sum test. What type of hypotheses is it used to test? What
assumptions are made for this test? What is the underlying concept?
(Essay)
4.9/5 (32)
If the critical values for a run test (found from table A-10)are 8 and 19 and the G value is 17, what should your conclusion about randomness be?
(Multiple Choice)
4.7/5 (35)
Why do researchers concentrate on explaining an interaction in a two -way ANOVA rather
than the effects of each factor separately?
(Essay)
4.8/5 (24)
A run chart for individual values is shown below. Does there appear to be a pattern suggesting
that the process is not within statistical control? If so, describe the pattern. 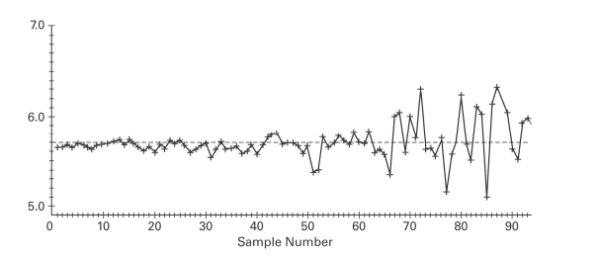
(Essay)
4.9/5 (38)
Use the data in the given table and the corresponding Minitab display to test the hypothesis.
The following table shows the mileage for four different cars and three different brands of
gas. Assuming no effect from the interaction between car and brand of gas, test the claim
that the four cars have the same mean mileage. Use a 0.05 significance level. Brand 1 Brand 2 Brand 3 Car 1 22.4 25.2 24.3 Car 2 19 18.6 19.8 Car 3 24.6 25 25.4 Car 4 23.5 23.6 24.1 Source DF SS MS F p Car 3 61.249 20.416 39.033 0.000249 Gas 2 2.222 1.111 2.124 0.200726 Error 6 3.138 0.523 Total 11 66.609
(Essay)
4.7/5 (35)
Identify the value of the test statistic._ Source DF SS MS Factor 3 30 10.00 1.6 0.264 Error 8 50 6.25 Total 11 80
(Multiple Choice)
4.8/5 (32)
The following data contains task completion times, in minutes, categorized according to the
gender of the machine operator and the machine used. Male Female Machine 1 15,17 16,17 Machine 2 14,13 15,13 Machine 3 16,18 17,19 The ANOVA results lead us to conclude that the completion times are not affected by an
interaction between machine and gender, and the times are not affected by gender, but they
are affected by the machine. Change the table entries so that there is no effect from the
interaction between machine and gender, but there is an effect from the gender of the
operator.
(Essay)
4.8/5 (37)
Define rank. Explain how to find the rank for data which repeats (for example, the data set: 4,_5, 5, 5, 7, 8, 12, 12, 15, 18).
(Essay)
4.9/5 (36)
Describe the three criteria used to determine if a control chart indicates a process which is not_
statistically stable.
(Essay)
4.9/5 (30)
Use the Minitab display to test the indicated claim. A manager records the production output of three employees who each work on three different machines for three different days. The
Sample results are given below and the Minitab results follow. Employee A B C I 16,18,19 15,17,20 14,18,16 Machine II 20,27,29 25,28,27 29,28,26 III 15,18,17 16,16,19 13,17,16
Analysis of variance Items SOURCE DF SS MS MACHINE 2 588.74 294.37 EMPLOYEE 2 2.07 1.04 INTERACTION 4 15.48 3.87 ERROR 18 98.67 5.48 TOTAL 26 704.96
Using a 0.05 significance level, test the claim that the interaction between employee and
Machine has no effect on the number of items produced. State your conclusion about the null
Hypothesis and the claim.
(Multiple Choice)
4.8/5 (30)
Filters
- Essay(0)
- Multiple Choice(0)
- Short Answer(0)
- True False(0)
- Matching(0)