Exam 12: Statistical Control Charts, Nonparametric Tests, and Hypothesis Testing
Exam 1: Introduction to Statistics59 Questions
Exam 2: Exploring Data With Tables and Graphs59 Questions
Exam 3: Describing, Exploring, and Comparing Data59 Questions
Exam 4: Probability60 Questions
Exam 5: Discrete Probability Distributions59 Questions
Exam 6: Normal Probability Distributions60 Questions
Exam 7: Estimating Parameters and Determining Sample Sizes58 Questions
Exam 8: Hypothesis Testing57 Questions
Exam 9: Inferences From Two Samples58 Questions
Exam 10: Correlation and Regression56 Questions
Exam 11: Chi-Square and Analysis of Variance60 Questions
Exam 12: Statistical Control Charts, Nonparametric Tests, and Hypothesis Testing181 Questions
Select questions type
Given below are the analysis of variance results from a Minitab display._ to use a 0.05 significance level in testing the null hypothesis that the different samples come
From populations with the same mean. Find the critical value. Source DF SS Factor 3 30 10.00 1.6 0.264 Error 8 50 6.25 Total 11 80
(Multiple Choice)
4.7/5  (32)
(32)
Provide an appropriate response. Describe what process data are. Why are process data
important to businesses? What is a common goal of businesses using quality control?
(Essay)
4.8/5 (37)
The following results are from a statistics software package in which all of the F values and P- 6)____________
values are given. Is there a significant effect from the interaction? Should you test to see if
there is a significant effect due to either A or B? If the answer is yes, is there a significant
effect due to either A or B? 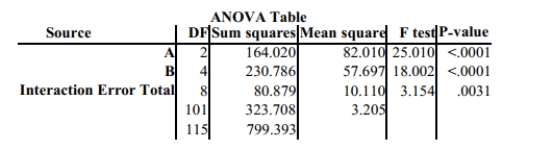
(Essay)
4.9/5 (45)
Match the parametric test with its related nonparametric test. Analysis of variance (F test)
(Multiple Choice)
4.9/5 (38)
Construct an R chart and determine whether the process variation is within statistical control.
Control Chart Constants
s R n 2 1.880 2.659 0.000 3.267 0.000 3.267 3 1.023 1.954 0.000 2.568 0.000 2.574 4 0.729 1.628 0.000 2.266 0.000 2.282 5 0.577 1.427 0.000 2.089 0.000 2.114 6 0.483 1.287 0.030 1.970 0.000 2.004 7 0.419 1.182 0.118 1.882 0.076 1.924 8 0.373 1.099 0.185 1.815 0.136 1.864 9 0.337 1.032 0.239 1.761 0.184 1.816 10 0.308 0.975 0.284 1.716 0.223 1.777
A machine that is supposed to fill small bottles to contain 20 milliliters yields the following data from a test of 4 bottles every hour.
Sample bottle Volume (oz) Range 1 19.9 20.1 20.2 20.3 20.125 0.4 2 20.4 20.0 20.3 20.3 20.250 0.4 3 20.0 20.7 20.4 20.3 20.350 0.7 4 20.4 20.1 20.1 19.9 20.125 0.5 5 19.9 19.8 19.6 19.5 19.700 0.4 6 19.4 19.4 19.6 19.7 19.525 0.3 7 19.8 19.4 19.6 19.7 19.625 0.4 8 19.9 19.8 20.0 20.0 19.925 0.2 9 20.2 20.3 20.1 20.3 20.225 0.2 10 20.0 20.3 20.0 20.2 20.125 0.3 11 20.3 20.5 20.1 20.2 20.275 0.4 12 20.1 19.9 19.8 19.7 19.875 0.4 13 19.5 19.8 19.7 19.6 19.650 0.3 14 19.4 19.8 19.8 19.4 19.400 0.4 15 19.5 19.6 19.6 19.9 19.650 0.4
(Essay)
4.9/5 (30)
Use the given process data to construct a control chart for p. If the weight of cereal in a_
particular packet is less than 14 ounces, the packet is considered nonconforming. Each week,
the manufacturer randomly selects 1,000 cereal packets and determines the number that are
nonconforming. The results for 12 consecutive weeks are shown below. 46 32 21 30 47 31 32 52 48 45 62 58
(Essay)
4.9/5 (35)
Test the claim that the samples come from populations with the same mean. Assume that the
populations are normally distributed with the same variance. At the 0.025 significance level,
test the claim that the four brands have the same mean if the following sample results have
been obtained. Brand A Brand B Brand C Brand D 17 18 21 22 20 18 24 25 21 23 25 27 22 25 26 29 21 26 29 35 29 36 37
(Essay)
4.8/5 (39)
Fill in the missing entries in the following partially completed one-way ANOVA table. Source Treatment 3 13.89 Error 13.58 0.617 Total
(Essay)
4.8/5 (41)
Which statement is false about the Wilcoxon signed-ranks test?
(Multiple Choice)
4.9/5 (39)
Use the data in the given table and the corresponding Minitab display to test the hypothesis.
The following table shows the mileage for four different cars and three different brands of
gas. Assuming no effect from the interaction between car and brand of gas, test the claim that
the four cars have the same mean mileage. Use a 0.05 significance level. Brand 1 Brand 2 Brand 3 Car 1 22.4 25.2 24.3 Car 2 19 18.6 19.8 Car 3 24.6 25 25.4 Car 4 23.5 23.6 24.1 Source DF SS MS F p Car 3 61.249 20.416 39.033 0.000249 Gas 2 2.222 1.111 2.124 0.200726 Error 6 3.138 0.523 Total 11 66.609
(Essay)
4.9/5 (39)
A rank correlation coefficient is to be calculated for a collection of paired data._ lie between -10 and 10. Which of the following could affect the value of the rank
Correlation coefficient?
I: Multiplying every value of one variable by 3
II: Interchanging the two variables
III: Adding 2 to each value of one variable
IV: Replacing every value of one variable by its absolute value
(Multiple Choice)
4.8/5 (37)
Explain what an efficiency rating is. You may use an example to explain this concept. Do
comparable parametric or nonparametric tests have higher efficiency ratings?
(Essay)
4.9/5 (34)
Examine the given run chart or control chart and determine whether the process is within_ statistical control. 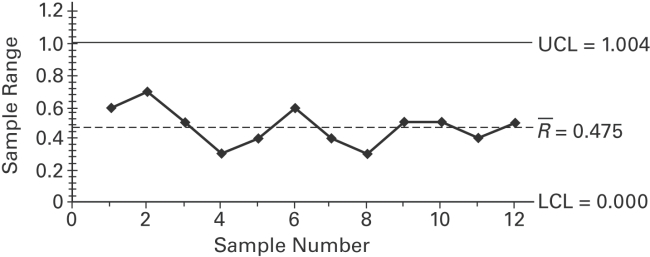
(Multiple Choice)
4.9/5 (38)
Solve the problem. Critical values for the runs test for randomness can be calculated by listing_
all possible sequences. Using the elements B, B, B, R, R, R list the 20 different possible
sequences. Find the number of runs for each sequence. Are you able to find 5% cutoff values
for G? What do you conclude?
(Essay)
4.8/5 (41)
Use the Minitab display to test the indicated claim. A manager records the production output
of three employees who each work on three different machines for three different days. The
sample results are given below and the Minitab results follow. Employee A B C Machine I 31,34,32 29,23,22 21,20,24 III 19,26,22 35,33,30 25,19,23 III, 18,26 20,23,24 36,37,31 ANALYSIS OF VARIANCE ITEMS SOURCE DF SS MS MACHINE 2 1.19 .59 EMPLOYEE 2 5.85 2.93 INTERACTION 4 710.81 177.70 ERROR 18 160.00 8.89 TOTAL 26 877.85 Assume that the number of items produced is not affected by an interaction between
employee and machine. Using a 0.05 significance level, test the claim that the machine has no
effect on the number of items produced.
(Essay)
4.9/5 (41)
Use the Minitab display to test the indicated claim. A manager records the production output of three employees who each work on three different machines for three different days. The
Sample results are given below and the Minitab results follow. Employee A B C I 16,18,19 15,17,20 14,18,16 Machine II 20,27,29 25,28,27 29,28,26 III 15,18,17 16,16,19 13,17,16
Analysis of Variance Items SOURCE DF SS MS MACHINE 2 588.74 294.37 EMPLOYEE 2 2.07 1.04 INTERACTION 4 15.48 3.87 ERROR 18 98.67 5.48 TOTAL 26 704.96
Assume that the number of items produced is not affected by an interaction between employee and machine. Using a significance level, test the claim that the choice of employee has no effect on the number of items produced. What is the value of the test statistic, ?
(Multiple Choice)
4.9/5 (34)
A control chart for is shown below. Determine whether the process mean is within statistical control. If it is not, identify which of the three out-of-control criteria lead to rejection of a statistically stable mean. 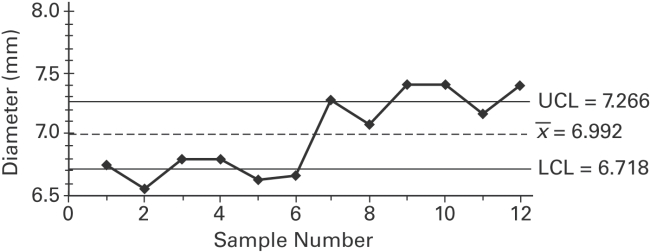
(Essay)
4.7/5 (30)
Construct an R chart and determine whether the process variation is within statistical control._
s R n 2 1.880 2.659 0.000 3.267 0.000 3.267 3 1.023 1.954 0.000 2.568 0.000 2.574 4 0.729 1.628 0.000 2.266 0.000 2.282 5 0.577 1.427 0.000 2.089 0.000 2.114 6 0.483 1.287 0.030 1.970 0.000 2.004 7 0.419 1.182 0.118 1.882 0.076 1.924 8 0.373 1.099 0.185 1.815 0.136 1.864 9 0.337 1.032 0.239 1.761 0.184 1.816 10 0.308 0.975 0.284 1.716 0.223 1.777
A machine that is supposed to produce ball bearings with a diameter of 7 millimeters yields the following data from a test of 5 ball bearings every 20 minutes.
Sample Ball Bearing Diameter (mm) Range 1 6.3 6.8 6.9 6.8 6.9 6.74 0.6 2 6.3 6.6 6.6 6.3 7.0 6.56 0.7 3 6.8 6.7 7.0 6.5 7.0 6.80 0.5 4 7.0 6.7 6.7 6.8 6.8 6.80 0.3 5 6.8 6.8 6.6 6.5 6.4 6.62 0.4 6 6.8 6.7 6.6 6.3 6.9 6.66 0.6 7 7.3 7.3 7.4 7.4 7.0 7.28 0.4 8 7.2 7.0 7.2 6.9 7.1 7.08 0.3 9 7.3 7.6 7.1 7.4 7.6 7.40 0.5 10 7.2 7.6 7.5 7.6 7.1 7.40 0.5 11 7.2 7.2 7.4 7.0 7.0 7.16 0.4 12 7.5 7.4 7.4 7.6 7.1 7.40 0.5
(Essay)
4.9/5 (33)
The data below represent the weight losses for people on three different exercise programs. Exercise A Exercise B Exercise C 2.5 5.8 4.3 8.8 4.9 6.2 7.3 1.1 5.8 9.8 7.8 8.1 5.1 1.2 7.9
If we want to test the claim that the three size categories have the same means, why don't we use three separate hypothesis tests for , and ?
(Essay)
4.9/5 (38)
Examine the given run chart or control chart and determine whether the process is within_ statistical control. 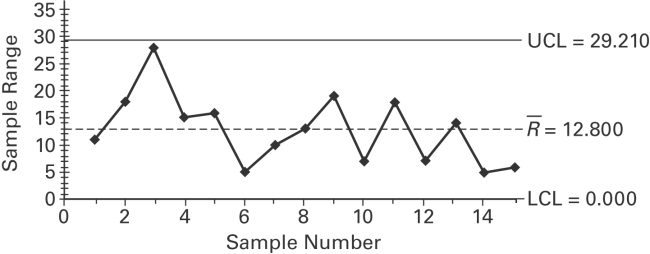
(Multiple Choice)
4.9/5 (41)
Filters
- Essay(0)
- Multiple Choice(0)
- Short Answer(0)
- True False(0)
- Matching(0)