Exam 12: Statistical Control Charts, Nonparametric Tests, and Hypothesis Testing
Exam 1: Introduction to Statistics59 Questions
Exam 2: Exploring Data With Tables and Graphs59 Questions
Exam 3: Describing, Exploring, and Comparing Data59 Questions
Exam 4: Probability60 Questions
Exam 5: Discrete Probability Distributions59 Questions
Exam 6: Normal Probability Distributions60 Questions
Exam 7: Estimating Parameters and Determining Sample Sizes58 Questions
Exam 8: Hypothesis Testing57 Questions
Exam 9: Inferences From Two Samples58 Questions
Exam 10: Correlation and Regression56 Questions
Exam 11: Chi-Square and Analysis of Variance60 Questions
Exam 12: Statistical Control Charts, Nonparametric Tests, and Hypothesis Testing181 Questions
Select questions type
A control chart for R is shown below. Determine whether the process variation is within_
statistical control. If it is not, identify which of the three out-of-control criteria lead to
rejection of statistically stable variation. 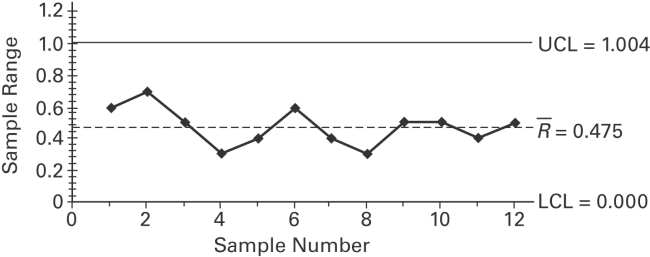
(Essay)
4.8/5  (34)
(34)
Four different judges each rank the quality of 20 different singers. What method can be used for agreement among the four judges?
(Multiple Choice)
4.9/5 (36)
Construct an chart and determine whether the process variation is within statistical control.
s R n 2 1.880 2.659 0.000 3.267 0.000 3.267 3 1.023 1.954 0.000 2.568 0.000 2.574 4 0.729 1.628 0.000 2.266 0.000 2.282 5 0.577 1.427 0.000 2.089 0.000 2.114 6 0.483 1.287 0.030 1.970 0.000 2.004 7 0.419 1.182 0.118 1.882 0.076 1.924 8 0.373 1.099 0.185 1.815 0.136 1.864 9 0.337 1.032 0.239 1.761 0.184 1.816 10 0.308 0.975 0.284 1.716 0.223 1.777
A machine that is supposed to produce ball bearings with a diameter of 7 millimeters yields the following data from a test of 5 ball bearings every 20 minutes.
Sample Ball Bearing Diameter (mm) Range 1 6.3 6.8 6.9 6.8 6.9 6.74 0.6 2 6.3 6.6 6.6 6.3 7.0 6.56 0.7 3 6.8 6.7 7.0 6.5 7.0 6.80 0.5 4 7.0 6.7 6.7 6.8 6.8 6.80 0.3 5 6.8 6.8 6.6 6.5 6.4 6.62 0.4 6 6.8 6.7 6.6 6.3 6.9 6.66 0.6 7 7.3 7.3 7.4 7.4 7.0 7.28 0.4 8 7.2 7.0 7.2 6.9 7.1 7.08 0.3 9 7.3 7.6 7.1 7.4 7.6 7.40 0.5 10 7.2 7.6 7.5 7.6 7.1 7.40 0.5 11 7.2 7.2 7.4 7.0 7.0 7.16 0.4 12 7.5 7.4 7.4 7.6 7.1 7.40 0.5
(Essay)
4.9/5 (38)
Provide an appropriate response. A common goal of quality control is to reduce variation in a
product or service. List and describe the two types of variability. Give an example of each.
(Essay)
4.8/5 (34)
Are control charts based on actual behavior or on desired behavior? Give an example to
illustrate the difference between the two types of behavior.
(Essay)
4.8/5 (33)
Examine the given run chart or control chart and determine whether the process is within_
statistical control. If it is not, identify which of the three out-of-statistical-control criteria apply. 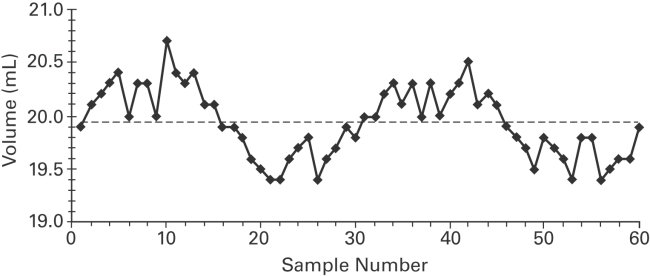
(Essay)
4.8/5 (28)
Use the runs test to determine whether the given sequence is random. Use a significance level of 0.05. The outcomes (odd number or even number)of a roulette wheel are shown below.
Test for randomness of odd (O)and even (E)numbers. Use a significance level of 0.05. What is the value of G, the number of runs?
(Multiple Choice)
4.8/5 (34)
Why do researchers concentrate on explaining an interaction in a two-way ANOVA rather than_
the effects of each factor separately?
(Essay)
4.9/5 (29)
Use the Wilcoxon signed -ranks test to test the claim that the matched pairs have differences_
that come from a population with a median equal to zero. Eleven runners are timed at the 100-
meter dash and are timed again one month later after following a new training program. The
times (in seconds)are shown in the table. Use Wilcoxon's signed-ranks test and a significance
level of 0.05 to test the claim that the training has no effect on the times. Before 12.1 12.4 11.7 11.5 11.0 11.8 12.3 10.8 12.6 12.7 10.7 After 11.9 12.4 11.8 11.4 11.2 11.5 12.0 10.9 12.0 12.2 11.1
(Essay)
4.7/5 (37)
Fill in the missing entries in the following partially completed one-way ANOVA table. Source Treatment 3 14.28 Error 13.50 0.643 Total
(Essay)
4.8/5 (28)
Use the runs test to determine whether the given sequence is random. Use a significance level_
of 0.05. A true-false test had the following answer sequence. T T T TFTFTFTFT TFT
T TFFFFFFFTFTFTF Test the null hypothesis that the sequence was random.
(Essay)
4.6/5 (23)
At the same time each day, a researcher records the temperature in each of three greenhouses. The table shows the temperatures in degrees Fahrenheit recorded for one week. Greenhouse \#1 Greenhouse \#2 Greenhouse \#3 73 71 67 72 69 63 73 72 62 66 72 61 68 65 60 71 73 62 72 71 59
What type of test would you use to test the claim that the average temperature is the same in
Each greenhouse at a 0.05 significance level?
(Multiple Choice)
4.9/5 (31)
The test statistics for one-way ANOVA is_
F . Describe variance
within samples and variance between samples. What relationship does variance within
samples and variance between samples would result in the conclusion that the value of F is
significant?
(Essay)
4.8/5 (39)
Use the given process data to construct a control chart for p. A drugstore considers a wait of
more than 5 minutes to be a defect. Each week 100 customers are randomly selected and
timed at the checkout line. The numbers of defects for 20 consecutive weeks are given below. 4 4 5 5 5 5 5 6 6 6 6 12 6 6 6 7 6 7 8 7
(Essay)
4.8/5 (32)
The following scatterplot shows the percentage of the vote a candidate received in the 2004_ senatorial elections according to the voter's income level based on an exit poll of voters
Conducted by CNN. The income levels 1 -8 correspond to the following income classes:
1 =Under $15,000; 2 =$15-30,000; 3=$30-50,000; 4=$50-75,000; 5=$75-100,000;
6=$100-150,000; 7=$150-200,000; 8=$200,000 or more. 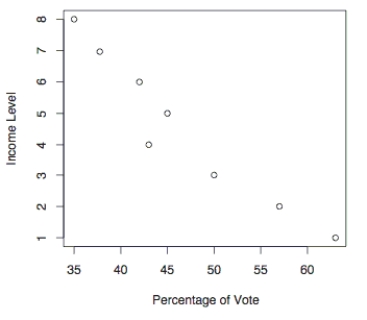 Use the election scatterplot to the find the critical values corresp onding to a 0.01
Significance level used to test the null hypothesis of ρs = 0.
Use the election scatterplot to the find the critical values corresp onding to a 0.01
Significance level used to test the null hypothesis of ρs = 0.
(Multiple Choice)
4.8/5 (43)
Use the Minitab display to test the indicated claim. A manager records the production output of_
three employees who each work on three different machines for three different days. The
sample results are given below and the Minitab results follow. Employee A B C Machine I 23,27,29 30,27,25 18,20,22 II 25,26,24 24,29,26 19,16,14 III 28,25,26 25,27,23 15,11,17 ANALYSIS OF VARIANCE ITEMS SOURCE DF SS MS MACHINE 2 34.67 17.33 EMPLOYEE 2 504.67 252.33 INTERACTION 4 26.67 6.67 ERROR 18 98.00 5.44 TOTAL 26 664.00 Assume that the number of items produced is not affected by an interaction between
employee and machine. Using a 0.05 significance level, test the claim that the machine has no
effect on the number of items produced.
(Essay)
4.9/5 (40)
Draw an example of an F distribution and list the characteristics of the F distribution.
(Essay)
4.9/5 (31)
Use the given process data to construct a control chart for p. A manufacturer monitors the level_ of defects in the television sets that it produces. Each week, 200 television sets are randomly selected and tested and the number of defects is recorded. The results for 12 consecutive weeks are shown below. 4 7 5 6 8 3 12 4 4 5 6 2
(Essay)
4.8/5 (36)
Assume that the number of items produced is not affected by an interaction between employee_
and machine. Using a 0.05 significance level, test the claim that the machine has no effect on
the number of items produced. Employee A B C I 16,18,19 15,17,20 14,18,16 Machine II 20,27,29 25,28,27 29,28,26 III 15,18,17 16,16,19 13,17,16 ANALYSIS OF VARIANCE ITEMS SOURCE DF SS MS MACHINE 2 588.74 294.37 EMPLOYEE 2 2.07 1.04 INTERACTION 4 15.48 3.87 ERROR 18 98.67 5.48 TOTAL 26 704.96 Using a 0.05 significance level, test the claim that the interaction between employee and
machine has no effect on the number of items produced.
(Essay)
4.8/5 (43)
The following data contains task completion times, in minutes, categorized according to the
gender of the machine operator and the machine used. Male Female Machine 1 15,17 16,17 Machine 2 14,13 15,13 Machine 3 16,18 17,19 Assume that two-way ANOVA is used to analyze the data. How are the ANOVA results
affected if the times are converted to hours?
(Essay)
4.9/5 (34)
Filters
- Essay(0)
- Multiple Choice(0)
- Short Answer(0)
- True False(0)
- Matching(0)