Exam 12: Statistical Control Charts, Nonparametric Tests, and Hypothesis Testing
Exam 1: Introduction to Statistics59 Questions
Exam 2: Exploring Data With Tables and Graphs59 Questions
Exam 3: Describing, Exploring, and Comparing Data59 Questions
Exam 4: Probability60 Questions
Exam 5: Discrete Probability Distributions59 Questions
Exam 6: Normal Probability Distributions60 Questions
Exam 7: Estimating Parameters and Determining Sample Sizes58 Questions
Exam 8: Hypothesis Testing57 Questions
Exam 9: Inferences From Two Samples58 Questions
Exam 10: Correlation and Regression56 Questions
Exam 11: Chi-Square and Analysis of Variance60 Questions
Exam 12: Statistical Control Charts, Nonparametric Tests, and Hypothesis Testing181 Questions
Select questions type
Use the given process data to construct a control chart for p. A drugstore considers a wait of more than 5 minutes to be a defect. Each week 100 customers are randomly selected and
Timed at the checkout line. The numbers of defects for 20 consecutive weeks are given below. 4 4 5 5 5 5 5 6 6 6 6 12 6 6 6 7 6 7 8 7 What is the value of the upper control limit?
(Multiple Choice)
4.9/5  (31)
(31)
Consider process data consisting of the amounts of potato chips (in ounces)in randomly selected bags of chips. The process is to be monitored with control charts based on samples
Of 50 bags randomly selected each day for 15 consecutive days of production. What does
X
Denote?
(Multiple Choice)
4.8/5 (31)
The following scatterplot shows the percentage of the vote a candidate received in the 2004_ senatorial elections according to the voter's income level based on an exit poll of voters
Conducted by CNN. The income levels 1 -8 correspond to the following income classes:
1 =Under $15,000; 2 =$15-30,000; 3=$30-50,000; 4=$50-75,000; 5=$75-100,000; 6=$100-
150,000; 7=$150-200,000; 8=$200,000 or more. 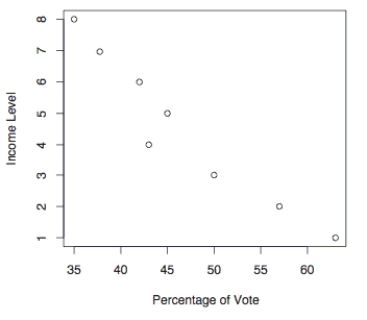 Use the election scatterplot to determine whether there is a correlation bet ween percentage of
Vote and income level at the 0.01 significance level with a null hypothesis of ρs = 0.
Use the election scatterplot to determine whether there is a correlation bet ween percentage of
Vote and income level at the 0.01 significance level with a null hypothesis of ρs = 0.
(Multiple Choice)
4.9/5 (36)
Examine the given run chart or control chart and determine whether the process is within
statistical control. If it is not, identify which of the three out-of-statistical-control criteria
apply. 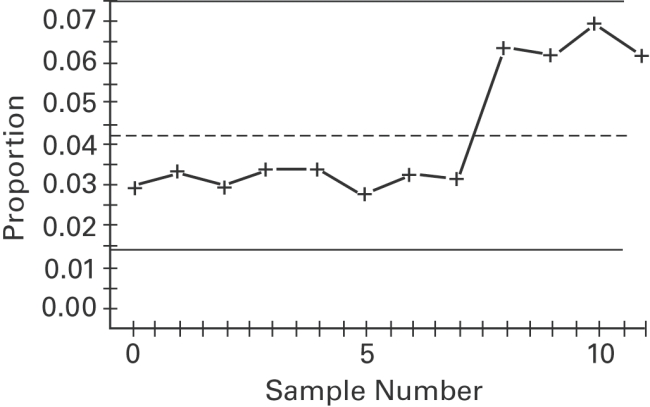
(Essay)
4.8/5 (35)
Examine the given run chart or control chart and determine whether the process is within statistical control. 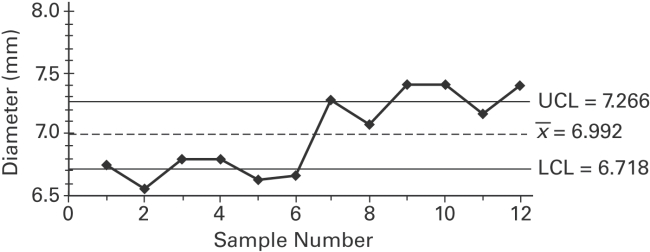
(Multiple Choice)
4.8/5 (38)
Find the critical value. Assume that the test is two-tailed and that n denotes the number of pairs of data.
n=30 ,
(Multiple Choice)
4.8/5 (38)
A manufacturer of lightbulbs picks 10 lightbulbs at random each day for quality control. The mean and range (in hours)of the lifetimes of the 10 lightbulbs are calculated. The results for
12 consecutive days are shown in the table below. Construct an R chart to determine whether
The process is in statistical control.
Day Range s 1 201.1 3.4 1.2 2 203.4 4.7 1.7 3 200.9 3.1 0.9 4 205.6 6.2 2.3 5 201.3 4.7 1.3 6 200.5 3.7 1.7 7 205.8 5.8 2.1 8 203.7 6.2 2.9 9 199.8 2.1 0.8 10 202.7 4.4 1.6 11 200.0 2.7 0.7 12 204.6 7.8 3.0
s R n 2 1.880 2.659 0.000 3.267 0.000 3.267 3 1.023 1.954 0.000 2.568 0.000 2.574 4 0.729 1.628 0.000 2.266 0.000 2.282 5 0.577 1.427 0.000 2.089 0.000 2.114 6 0.483 1.287 0.030 1.970 0.000 2.004 7 0.419 1.182 0.118 1.882 0.076 1.924 8 0.373 1.099 0.185 1.815 0.136 1.864 9 0.337 1.032 0.239 1.761 0.184 1.816 10 0.308 0.975 0.284 1.716 0.223 1.777
(Multiple Choice)
4.9/5 (42)
Find the ranks corresponding to the ages of five statistics professors when they were hired:_ 47, 51, 47, 47, 48
(Multiple Choice)
4.7/5 (36)
Use the sign test to test the indicated claim. A researcher wishes to test whether a particular
diet has an effect on blood pressure. The blood pressure of 25 randomly selected adults is
measured. After one month on the diet, each person's blood pressure is again measured. For
19 people, the second blood pressure reading was lower than the first, and for 6 people, the
second blood pressure reading was higher than the first. At the 0.01 significance level, test the
claim that the diet has an effect on blood pressure.
(Essay)
4.8/5 (38)
Describe an R chart and give an example. What does it attempt to monitor?
(Essay)
4.7/5 (37)
The data below represent the weight losses for people on three different exercise programs. Exercise A Exercise B Exercise 2.5 5.8 4.3 8.8 4.9 6.2 7.3 1.1 5.8 9.8 7.8 8.1 5.1 1.2 7.9
If we want to test the claim that the three size categories have the same means, why don't we use three separate hypothesis tests for , and ?
(Multiple Choice)
4.8/5 (30)
Sketch a control chart that indicates that a process is not statistically stable due to the run of 8
rule.
(Essay)
4.8/5 (25)
Use the Minitab display to test the indicated claim. A manager records the production output of_
three employees who each work on three different machines for three different days. The
sample results are given below and the Minitab results follow. Employee A B C Machine I 31,34,32 29,23,22 21,20,24 II 19,26,22 35,33,30 25,19,23 III 21,18,26 20,23,24 36,37,31 ANALYSIS OF VARIANCE ITEMS SOURCE DF SS MS MACHINE 2 1.19 .59 EMPLOYEE 2 5.85 2.93 INTERACTION 4 710.81 177.70 ERROR 18 160.00 8.89 TOTAL 26 877.85 Using a 0.05 significance level, test the claim that the interaction between employee and
machine has no effect on the number of items produced.
(Essay)
4.8/5 (26)
Use the runs test to determine whether the given sequence is random. Use a significance level
of 0.05. A sample of 30 clock radios is selected in sequence from an assembly line. Each
radio is examined and judged to be acceptable (A)or defective (D). The results are shown
below. Test for randomness. A A D A A A D A A D A D A A A D A A A A A A D D A A A A D A
(Essay)
4.8/5 (37)
What is the corresponding parametric test for the Kruskal-Wallis test?
(Multiple Choice)
4.9/5 (31)
Explain the procedure for two-way analysis of variance varies depending on whether there is
an interaction between the two factors or not.
(Essay)
4.9/5 (39)
Select an appropriate null hypothesis for a one way analysis of variance test.
A)
B)
C)
D)
(Short Answer)
4.8/5 (31)
The following data contains task completion times, in minutes, categorized according to the_
gender of the machine operator and the machine used. Male Female Machine 1 15,17 16,17 Machine 2 14,13 15,13 Machine 3 16,18 17,19
The ANOVA results lead us to conclude that the completion times are not affected by an
interaction between machine and gender, and the times are not affected by gender, but they
are affected by the machine. Change the table entries so that there is an effect from the
interaction between machine and gender.
(Essay)
4.8/5 (39)
Given below are the analysis of variance results from a Minitab display._ to use a 0.05 significance level in testing the null hypothesis that the different samples come
From populations with the same mean. What can you conclude about the equality of the
Population means? Source Factor 3 13.500 4.500 5.17 0.011 Error 16 13.925 0.870 Total 19 27.425
(Multiple Choice)
4.8/5 (32)
Use the sign test to test the indicated claim. The heights of 16 randomly selected women are
given below. Use a significance level of 0.05 to test the claim that the population median is
equal to 64.0 inches. 62.9 61.9 66.4 68.5 63.7 64.0 65.2 67.0 70.2 65.3 64.0 60.3 64.3 66.9 65.0 63.8
(Essay)
4.9/5 (34)
Filters
- Essay(0)
- Multiple Choice(0)
- Short Answer(0)
- True False(0)
- Matching(0)