Exam 12: Statistical Control Charts, Nonparametric Tests, and Hypothesis Testing
Exam 1: Introduction to Statistics59 Questions
Exam 2: Exploring Data With Tables and Graphs59 Questions
Exam 3: Describing, Exploring, and Comparing Data59 Questions
Exam 4: Probability60 Questions
Exam 5: Discrete Probability Distributions59 Questions
Exam 6: Normal Probability Distributions60 Questions
Exam 7: Estimating Parameters and Determining Sample Sizes58 Questions
Exam 8: Hypothesis Testing57 Questions
Exam 9: Inferences From Two Samples58 Questions
Exam 10: Correlation and Regression56 Questions
Exam 11: Chi-Square and Analysis of Variance60 Questions
Exam 12: Statistical Control Charts, Nonparametric Tests, and Hypothesis Testing181 Questions
Select questions type
Use the sign test to test the indicated claim. An instructor gives a test before and after a lesson
and results from randomly selected students are given below. At the 0.05 level of significance,
test the claim that the lesson has no effect on the grade. Use the sign test. Before 54 61 56 41 38 57 42 71 88 42 36 23 22 46 51 After 82 87 84 76 79 87 42 97 99 74 85 96 69 84 79
(Essay)
4.9/5  (35)
(35)
Use the rank correlation coefficient to test for a correlation between the two variables. A_
placement test is required for students desiring to take a finite mathematics course at a
university. The instructor of the course studies the relationship between students' placement
test score and final course score. A random sample of eight students yields the following data. Placement Score Final Course Score 38 63 90 41 95 54 51 32 86 93 74 60 60 61 57 89 Compute the rank correlation coefficient, rs, of the data and test the claim of correlation
between placement score and final course score. Use a significance level of 0.05.
(Essay)
4.7/5 (40)
Describe the runs test for randomness. What types of hypotheses is it used to test? Does the
runs test measure frequency? What is the underlying concept?
(Essay)
4.8/5 (39)
Use the Minitab display to test the indicated claim. A manager records the production output of_
three employees who each work on three different machines for three different days. The
sample results are given below and the Minitab results follow. Employee A B C Machine I 31,34,32 29,23,22 21,20,24 II 19,26,22 35,33,30 25,19,23 III 21,18,26 20,23,24 36,37,31
ANALYSIS OF VARIANCE ITEMS SOURCE DF SS MS MACHINE 2 1.19 .59 EMPLOYEE 2 5.85 2.93 INTERACTION 4 710.81 177.70 ERROR 18 160.00 8.89 TOTAL 26 877.85 Assume that the number of items produced is not affected by an interaction between
employee and machine. Using a 0.05 significance level, test the claim that the choice of
employee has no effect on the number of items produced.
(Essay)
4.9/5 (33)
Which of the following distribution-free tests has the lowest efficiency rating compared to_ its parametric counterpart?
(Multiple Choice)
4.9/5 (42)
Use the rank correlation coefficient to test for a correlation between the two variables._
Ten trucks were ranked according to their comfort levels and their prices. Make Comfort Price A 1 6 B 6 2 C 2 3 D 8 1 E 4 4 F 7 8 G 9 10 H 10 9 I 3 5 J 5 7 Find the rank correlation coefficient and test the claim of correlation between comfort and
price. Use a significance level of 0.05.
(Essay)
5.0/5 (37)
Which graph using individual data values instead of a process characteristic?
(Multiple Choice)
4.8/5 (35)
________________ measurement of a characteristic or good or services that result from some combination of
Equipment, people, materials, methods, and conditions.
(Multiple Choice)
4.9/5 (30)
Examine the given run chart or control chart and determine whether the process is within_
statistical control. If it is not, identify which of the three out-of-statistical-control criteria apply. 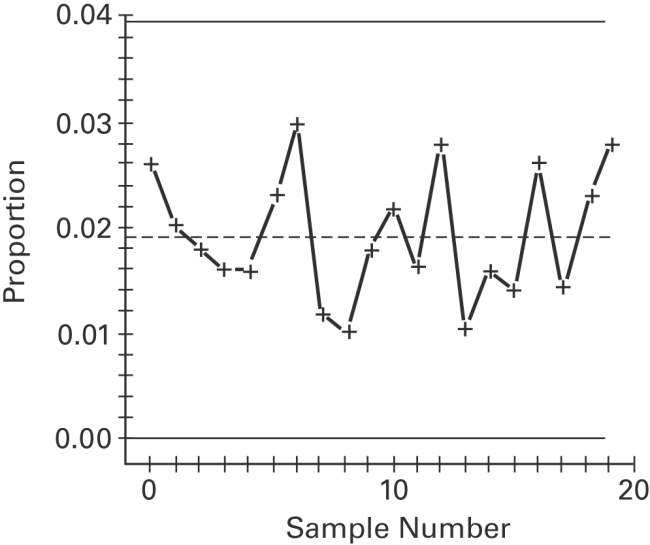
(Essay)
4.7/5 (33)
Which of the following terms is sometimes used instead of "non-parametric test"?_
(Multiple Choice)
4.8/5 (29)
Test the claim that the samples come from populations with the same mean. Assume that the
populations are normally distributed with the same variance. At the 0.025 significance level,
test the claim that the three brands have the same mean if the following sample results have
been obtained. Brand A Brand B Brand C 32 27 22 34 24 25 37 33 32 33 30 22 36 21 39
(Essay)
4.8/5 (37)
Examine the given run chart or control chart and determine whether the process is within statistical control. 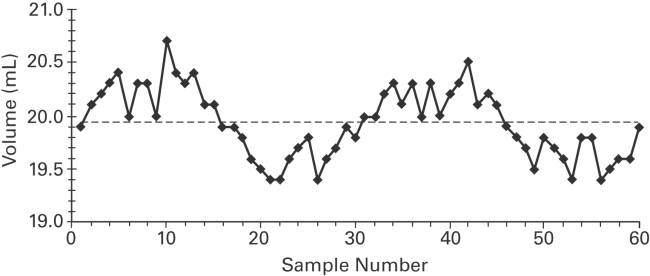
(Multiple Choice)
4.9/5 (49)
Give at least two examples of nonparametric tests and their comparable parametric tests.
(Essay)
4.9/5 (40)
Which of the following is not an application of the sign test?
(Multiple Choice)
4.8/5 (37)
Describe the sign test. What types of hypotheses is it used to test? What is the underlying
concept?
(Essay)
5.0/5 (39)
Use a 0.05 level of significance to test the claim that the sequence of computer -generated
numbers is random. Test for randomness above and below the mean.
(Essay)
4.9/5 (33)
Use the data in the given table and the corresponding Minitab display to test the hypothesis.
The following table shows the mileage for four different cars and three different brands of
gas. Assuming no effect from the interaction between car and brand of gas, test the claim that
the three brands of gas provide the same mean gas mileage. Use a 0.05 significance level. Brand 1 Brand 2 Brand 3 Car 1 22.4 25.2 24.3 Car 2 19 18.6 19.8 Car 3 24.6 25 25.4 Car 4 23.5 23.6 24.1 Source DF SS MS F p Car 3 61.249 20.416 39.033 0.000249 Gas 2 2.222 1.111 2.124 0.200726 Error 6 3.138 0.523 Total 11 66.609
(Essay)
4.8/5 (34)
Use a Kruskal-Wallis test to test the claim that the samples come from populations with equal_
medians. Listed below are grade averages for randomly selected students with three different
categories of high-school background. At the 0.05 level of significance, test the claim that the
three groups have the same median grade average. HIGH SCHOOL RECORD Good Fair Poor 3.21 2.87 2.01 3.65 3.05 2.31 1.00 2.00 2.98 3.12 0.00 0.50 2.75 1.98 2.36
(Essay)
4.9/5 (42)
Use the runs test to determine whether the given sequence is random. Use a significance level_
of 0.05. The sequence of numbers below represents the maximum temperature (in degrees
Fahrenheit)in July in one U.S. town for 30 consecutive years. Test the sequence for
randomness above and below the median. 94 96 97 99 95 90 97 98 100
92 95 98 99 102 97 97 101 99 100 98 95 93 99 101 99 101 100 99 103
94 96 97 99 95 90 97 98 100 100 92 95 98 99 102 97 97 101 99 100 98 95 93 99 101 99 101 100 99 103
98 95 93 99 101 99 101 100 99 103
(Essay)
4.9/5 (33)
Filters
- Essay(0)
- Multiple Choice(0)
- Short Answer(0)
- True False(0)
- Matching(0)