Exam 12: Statistical Control Charts, Nonparametric Tests, and Hypothesis Testing
Exam 1: Introduction to Statistics59 Questions
Exam 2: Exploring Data With Tables and Graphs59 Questions
Exam 3: Describing, Exploring, and Comparing Data59 Questions
Exam 4: Probability60 Questions
Exam 5: Discrete Probability Distributions59 Questions
Exam 6: Normal Probability Distributions60 Questions
Exam 7: Estimating Parameters and Determining Sample Sizes58 Questions
Exam 8: Hypothesis Testing57 Questions
Exam 9: Inferences From Two Samples58 Questions
Exam 10: Correlation and Regression56 Questions
Exam 11: Chi-Square and Analysis of Variance60 Questions
Exam 12: Statistical Control Charts, Nonparametric Tests, and Hypothesis Testing181 Questions
Select questions type
A control chart for R is shown below. Determine whether the process variation is within_
statistical control. If it is not, identify which of the three out-of-control criteria lead to rejection
of statistically stable variation. 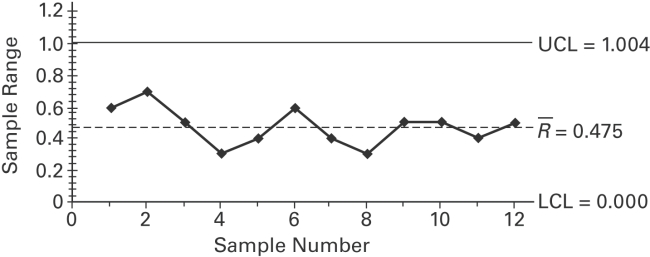
(Essay)
4.8/5  (26)
(26)
Explain the procedure for two-way analysis of variance, and how it varies depending on
whether there is an interaction between the two factors or not.
(Essay)
4.8/5 (39)
Use the sign test to test the indicated claim. A researcher wishes to test whether a particular diet has an effect on blood pressure. The blood pressure of 24 randomly selected adults is
Measured. After one month on the diet, each person's blood pressure is again measured. For
18 people, the second blood pressure reading was lower than the first, and for 6 people, the
Second blood pressure reading was higher than the first. At the 0.01 significance level, test the
Claim that the diet has an effect on blood pressure. What would be the value of the test
Statistic, x?
(Multiple Choice)
4.9/5 (34)
The test statistic for one-way ANOVA is equal to _________________.
A)
B)
C)
D)
(Short Answer)
4.8/5 (26)
Examine the given run chart or control chart and determine whether the process is
within statistical control. If it is not, identify which of the three out-of-statistical-control
criteria apply. 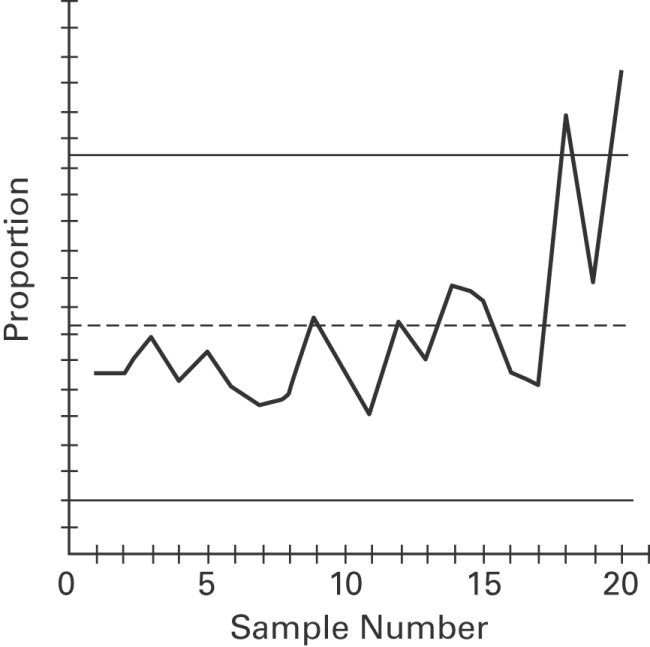
(Essay)
4.9/5 (27)
Match the parametric test with its comparable nonparametric test.
1)matched pair t test
2)two independent samples t test
3)analysis of variance (F test)
4)linear correlation
A)rank correlation test
B)Wilcoxon rank-sum test
C)Kruskal-Wallis test
D)sign test
(Essay)
4.8/5 (32)
Use the runs test to determine whether the given sequence is random. Use a significance level_
of 0.05. Test the sequence of digits below for randomness above and below the value of 4.5. 0 4 7 3 6 0 9 7 4 8 7 2 8 5 7 3 9 6 4 6 4 7 9 1 6 1 9 5 8 3 7 8 5 7 3 5 2 9 3 8
(Essay)
4.9/5 (35)
A _________________ is a sequential plot of individual data values over time. One axis is used_ for the data values, and the other axis is used for the time sequence.
(Multiple Choice)
4.8/5 (28)
Match the chart with its characteristic.
-Monitors variation in a process
(Multiple Choice)
4.8/5 (37)
A control chart for attributes is to be constructed.
limits, a process which has been having a 5% rate of nonconforming items, or a process which
has been having a 10% of nonconforming items? Assume that both processes have the same
sample sizes. For a given sample size, would it be easier to detect a shift from 5% to 10% or a
shift from 10% to 15%? Explain your reasoning.
(Essay)
5.0/5 (30)
A control chart for is shown below._
statistical control. If it is not, identify which of the three out-of-control criteria lead to
rejection of a statistically stable mean. 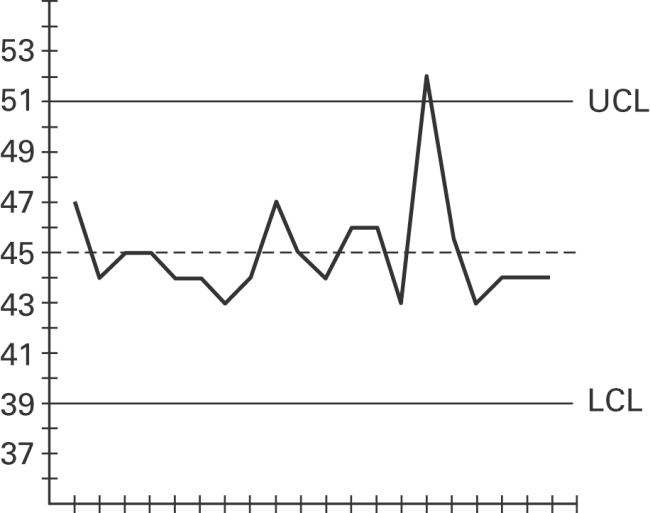
(Essay)
4.9/5 (43)
Use a Kruskal-Wallis test to test the claim that the samples come from populations with equal
medians. The table below shows the weights (in pounds)of 6 randomly selected women in
each of three different age groups. Use a 0.01 significance level to test the claim that the 3
age-groups have the same median weight. 18-34 35-55 56 and older 119 123 140 134 147 128 114 135 59 125 110 134 153 154 120 138 163 116
(Essay)
4.8/5 (29)
__________________ variation results from causes that can be identified._
(Multiple Choice)
4.8/5 (29)
Describe the three criteria used to determine if a control chart indicates a process which is not_
statistically stable.
(Essay)
4.8/5 (29)
A teacher uses two different CAI programs to remediate a randomly selected group of
students. Results for two independent samples on a standardized test are listed in a table
below. At the 0.05 level of significance, use the Wilcoxon rank-sum test to test the hypothesis
that the sample results are from populations with equal medians. Program I Program II 60 75 61 63 66 89 68 77 86 69 64 70 84 80 81 87 72 82 59 78 73 91 93 94 95
(Essay)
4.9/5 (26)
Construct a run chart for individual values corresponding to the given data. A machine that is_
supposed to produce ball bearings with a diameter of 7 millimeters yields the following data
from a test of 5 ball bearings every 20 minutes. Sample Ball Bearing Diameter (mm) Range 1 6.3 6.8 6.9 6.8 6.9 6.74 0.6 2 6.3 6.6 6.6 6.3 7.0 6.56 0.7 3 6.8 6.7 7.0 6.5 7.0 6.80 0.5 4 7.0 6.7 6.7 6.8 6.8 6.80 0.3 5 6.8 6.8 6.6 6.5 6.4 6.62 0.4 6 6.8 6.7 6.6 6.3 6.9 6.66 0.6 7 7.3 7.3 7.4 7.4 7.0 7.28 0.4 8 7.2 7.0 7.2 6.9 7.1 7.08 0.3 9 7.3 7.6 7.1 7.4 7.6 7.40 0.5 10 7.2 7.6 7.5 7.6 7.1 7.40 0.5 11 7.2 7.2 7.4 7.0 7.0 7.16 0.4 12 7.5 7.4 7.4 7.6 7.1 7.40 0.5
(Essay)
4.8/5 (36)
Use the rank correlation coefficient to test for a correlation between the two variables.
Given that the rank correlation coefficient, rs, for 37 pairs of data is 0.324, test the claim of
correlation between the two variables. Use a significance level of 0.01.
(Essay)
4.8/5 (36)
Test the claim that the samples come from populations with the same mean. Assume that the_
populations are normally distributed with the same variance. Exercise A Exercise B Exercise 2.5 5.8 4.3 8.8 4.9 6.2 7.3 1.1 5.8 9.8 7.8 8.1 5.1 1.2 7.9 At the 1% significance level, does it appear that a difference exists in the true mean weight
loss produced by the three exercise programs?
(Essay)
4.8/5 (32)
Which type of chart would be best for monitoring the proportion of items that are defective?
(Multiple Choice)
4.7/5 (31)
A standard aptitude test is given to several randomly selected programmers, and the scores are
given below for the mathematics and verbal portions of the test. Use the sign test to test the
claim that programmers do better on the mathematics portion of the test. Use a 0.05 level of
significance. start text Mathematics end text 347 440 327 456 427 349 377 398 425 start text verbal end text 285 378 243 371 340 271 294 322 385
(Essay)
4.8/5 (32)
Filters
- Essay(0)
- Multiple Choice(0)
- Short Answer(0)
- True False(0)
- Matching(0)