Exam 8: Nonlinear Regression Functions
Exam 1: Economic Questions and Data11 Questions
Exam 2: Review of Probability61 Questions
Exam 3: Review of Statistics56 Questions
Exam 4: Linear Regression With One Regressor54 Questions
Exam 5: Regression With a Single Regressor: Hypothesis Tests and Confidence Intervals53 Questions
Exam 6: Linear Regression With Multiple Regressors54 Questions
Exam 7: Hypothesis Tests and Confidence Intervals in Multiple Regression50 Questions
Exam 8: Nonlinear Regression Functions53 Questions
Exam 9: Assessing Studies Based on Multiple Regression55 Questions
Exam 10: Regression With Panel Data40 Questions
Exam 11: Regression With a Binary Dependent Variable40 Questions
Exam 12: Instrumental Variables Regression40 Questions
Exam 13: Experiments and Quasi-Experiments40 Questions
Exam 14: Introduction to Time Series Regression and Forecasting36 Questions
Exam 15: Estimation of Dynamic Causal Effects40 Questions
Exam 16: Additional Topics in Time Series Regression40 Questions
Exam 17: The Theory of Linear Regression With One Regressor39 Questions
Exam 18: The Theory of Multiple Regression38 Questions
Select questions type
Sports economics typically looks at winning percentages of sports teams as one of
various outputs, and estimates production functions by analyzing the relationship
between the winning percentage and inputs.In Major League Baseball (MLB), the
determinants of winning are quality pitching and batting.All 30 MLB teams for the 1999
season.Pitching quality is approximated by "Team Earned Run Average" (ERA), and
hitting quality by "On Base Plus Slugging Percentage" (OPS). Summary of the Distribution of Winning Percentage, On Base Plus Slugging Percentage, and Team Earned Run Average for MLB in 1999
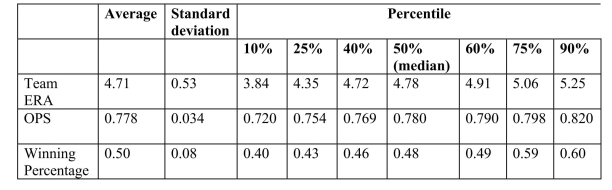 Your regression output is:
= -0.19-0.099\times teamera +1.490\times ops ,=0.92, SER =0.02. (0.08)(0.008)(0.126) (a)Interpret the regression.Are the results statistically significant and important?
Your regression output is:
= -0.19-0.099\times teamera +1.490\times ops ,=0.92, SER =0.02. (0.08)(0.008)(0.126) (a)Interpret the regression.Are the results statistically significant and important?
(Essay)
4.8/5  (40)
(40)
Females, it is said, make 70 cents to the dollar in the United States.To investigate this
phenomenon, you collect data on weekly earnings from 1,744 individuals, 850 females
and 894 males.Next, you calculate their average weekly earnings and find that the
females in your sample earned $346.98, while the males made $517.70.
(a)Calculate the female earnings in percent of the male earnings.How would you test
whether or not this difference is statistically significant? Give two approaches.
(Essay)
4.9/5 (37)
Assume that you had data for a cross-section of 100 households with data on
consumption and personal disposable income.If you fit a linear regression function
regressing consumption on disposable income, what prior expectations do you have about
the slope and the intercept? The slope of this regression function is called the "marginal
propensity to consume." If, instead, you fit a log-log model, then what is the
interpretation of the slope? Do you have any prior expectation about its size?
(Essay)
4.8/5 (35)
The figure shows is a plot and a fitted linear regression line of the age-earnings profile of
1,744 individuals, taken from the Current Population Survey.  (a)Describe the problems in predicting earnings using the fitted line.What would the pattern
of the residuals look like for the age category under 40?
(a)Describe the problems in predicting earnings using the fitted line.What would the pattern
of the residuals look like for the age category under 40?
(Essay)
4.9/5 (33)
Many countries that experience hyperinflation do not have market-determined interest
rates.As a result, some authors have substituted future inflation rates into money demand
equations of the following type as a proxy:
( is real money, and is the consumer price index).
Income is typically omitted since movements in it are dwarfed by money growth and the inflation rate. Authors have then interpreted as the "semi-elasticity" of the inflation rate. Do you see any problems with this interpretation?
(Essay)
4.8/5 (37)
In nonlinear models, the expected change in the dependent variable for a change in one of the explanatory variables is given by a. .
b. .
c. .
d.
(Short Answer)
4.8/5 (32)
(Requires Calculus)Show that for the log-log model the slope coefficient is the
elasticity.
(Essay)
4.9/5 (43)
Choose at least three different nonlinear functional forms of a single independent
variable and sketch the relationship between the dependent and independent variable.
(Essay)
4.9/5 (36)
The exponential function a. is the inverse of the natural logarithm function.
b. does not play an important role in modeling nonlinear regression functions in econometrics.
c. can be written as .
d. is , where is .
(Short Answer)
4.8/5 (39)
To investigate whether or not there is discrimination against a sub-group of individuals,
you regress the log of earnings on determining variables, such as education, work
experience, etc., and a binary variable which takes on the value of one for individuals in
that sub-group and is zero otherwise.You consider two possible specifications.First you
run two separate regressions, one for the observations that include the sub-group and one
for the others.Second, you run a single regression, but allow for a binary variable to
appear in the regression.Your professor suggests that the second equation is better for the
task at hand, as long as you allow for a shift in both the intercept and the slopes.Explain
her reasoning.
(Essay)
4.7/5 (33)
In the log-log model, the slope coefficient indicates a. the effect that a unit change in has on .
b. the elasticity of with respect to .
c. .
d. .
(Short Answer)
4.9/5 (40)
The interpretation of the slope coefficient in the model
is as follows:
(Multiple Choice)
4.8/5 (39)
Including an interaction term between two independent variables, allows for the following, except that:
(Multiple Choice)
5.0/5 (34)
To test whether or not the population regression function is linear rather than a polynomial of order r, a. check whether the regression for the polynomial regression is higher than that of the linear regression.
b. compare the TSS from both regressions.
c. look at the pattern of the coefficients: if they change from positive to negative to positive, etc., then the polynomial regression should be used.
d. use the test of restrictions using the -statistic.
(Short Answer)
4.8/5 (42)
Indicate whether or not you can linearize the regression functions below so that OLS
estimation methods can be applied:
(a)
(Essay)
4.9/5 (36)
You have learned that earnings functions are one of the most investigated relationships in
economics.These typically relate the logarithm of earnings to a series of explanatory
variables such as education, work experience, gender, race, etc.
(a)Why do you think that researchers have preferred a log-linear specification over a linear
specification? In addition to the interpretation of the slope coefficients, also think about
the distribution of the error term.
(Essay)
4.8/5 (50)
A polynomial regression model is specified as: a. .
b. .
c. .
d. .
(Short Answer)
4.9/5 (38)
To decide whether
fits the data better, you cannot consult the regression R2 because
(Multiple Choice)
4.7/5 (35)
Filters
- Essay(0)
- Multiple Choice(0)
- Short Answer(0)
- True False(0)
- Matching(0)