Exam 20: Probability and Combinatorics
Exam 1: Defining and Collecting Data202 Questions
Exam 2: Organizing and Visualizing256 Questions
Exam 3: Numerical Descriptive Measures217 Questions
Exam 4: Basic Probability167 Questions
Exam 5: Discrete Probability Distributions165 Questions
Exam 6: The Normal Distribution and Other Continuous Distributions170 Questions
Exam 7: Sampling Distributions165 Questions
Exam 8: Confidence Interval Estimation219 Questions
Exam 9: Fundamentals of Hypothesis Testing: One-Sample Tests194 Questions
Exam 10: Two-Sample Tests240 Questions
Exam 11: Analysis of Variance170 Questions
Exam 12: Chi-Square and Nonparametric188 Questions
Exam 13: Simple Linear Regression243 Questions
Exam 14: Introduction to Multiple394 Questions
Exam 15: Multiple Regression146 Questions
Exam 16: Time-Series Forecasting235 Questions
Exam 17: Getting Ready to Analyze Data386 Questions
Exam 18: Statistical Applications in Quality Management159 Questions
Exam 19: Decision Making126 Questions
Exam 20: Probability and Combinatorics421 Questions
Select questions type
The bootstrap confidence interval estimate for the population mean is constructed
based on the sampling distribution of the m population means.
(True/False)
4.9/5  (31)
(31)
SCENARIO 5-12
Two different designs on a new line of winter jackets for the coming winter are available for your
manufacturing plants. Your profit (in thousands of dollars) will depend on the taste of the consumers
when winter arrives. The probability of the three possible different tastes of the consumers and the
corresponding profits are presented in the following table. Probability Taste Design A Design B 0.2 more conservative 180 520 0.5 no change 230 310 0.3 more liberal 350 270
-Referring to Scenario 5-12, if you decide to choose Design A for half of the production lines and
Design B for the other half, what is your expected profit?
(Short Answer)
4.9/5 (32)
SCENARIO 5-11
There are two houses with almost identical characteristics available for investment in two different
neighborhoods with drastically different demographic composition. The anticipated gain in value
when the houses are sold in 10 years has the following probability distribution: 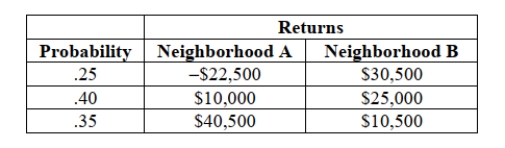 -Referring to Scenario 5-11, what is the expected value gain if you invest in both houses?
(Short Answer)
4.9/5 (30)
SCENARIO 9-14
An appliance manufacturer claims to have developed a compact microwave oven that consumes a
population mean of no more than 250 W. From previous studies, it is believed that power
consumption for microwave ovens is normally distributed with a population standard deviation of 15
W. If there is evidence that the population mean consumption is greater than 250 W, the manufacturer
will be unable to make the claim.
-Referring to Scenario 9-14, if you select a sample of 20 compact microwave ovens and are
willing to have a level of significance of 0.05, the power of the test is _____ if the mean power
consumption of all such microwave ovens is in fact 257.3 W.
(Short Answer)
4.9/5 (40)
The amount of time between successive TV watching by first graders follows an exponential
distribution with a mean of 10 hours. The probability that a given first grader spends more than 5
hours between successive TV watching is ______.
(Short Answer)
4.8/5 (36)
SCENARIO 5-11
There are two houses with almost identical characteristics available for investment in two different
neighborhoods with drastically different demographic composition. The anticipated gain in value
when the houses are sold in 10 years has the following probability distribution:
-Referring to Scenario 5-11, if you can invest 10% of your money on the house in neighborhood A
and the remaining on the house in neighborhood B, what is the portfolio risk of your investment?
(Short Answer)
4.9/5 (38)
A study is under way in Yosemite National Forest to determine the adult height of American pine trees. Specifically, the study is attempting to determine what factors aid a tree in reaching heights
Greater than 60 feet tall. It is estimated that the forest contains 25,000 adult American pines. The
Study involves collecting heights from 250 randomly selected adult American pine trees and
Analyzing the results. Identify the variable of interest in the study.
(Multiple Choice)
4.8/5 (23)
In the current data-driven environment of business, the decisions you make will be
increasingly based on gut or intuition supported by personal experience.
(True/False)
5.0/5 (43)
SCENARIO 12-20
The director of the MBA program of a state university wanted to know if a one week orientation
would change the proportion among potential incoming students who would perceive the program as
being good. Given below is the result from 215 students' view of the program before and after the
orientation. 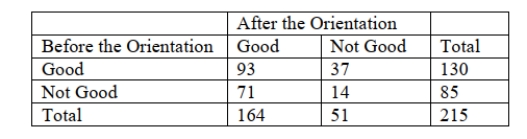 -Referring to Scenario 12-20, what is the p-value of the test statistic using a 5% level of
significance?
-Referring to Scenario 12-20, what is the p-value of the test statistic using a 5% level of
significance?
(Short Answer)
4.7/5 (44)
SCENARIO 5-11
There are two houses with almost identical characteristics available for investment in two different
neighborhoods with drastically different demographic composition. The anticipated gain in value
when the houses are sold in 10 years has the following probability distribution:
-Referring to Scenario 5-11, if your investment preference is to minimize the amount of risk that
you have to take and do not care at all about the expected return, will you choose a portfolio that
will consist of 10%, 30%, 50%, 70%, or 90% of your money on the house in neighborhood A and
the remaining on the house in neighborhood B?
(Short Answer)
4.8/5 (31)
Most analysts focus on the cost of tuition as the way to measure the cost of a college education. But incidentals, such as textbook costs, are rarely considered. A researcher at Drummand
University wishes to estimate the textbook costs of first-year students at Drummand. To do so,
She monitored the textbook cost of 250 first-year students and found that their average textbook
Cost was $600 per semester. Identify the variable of interest to the researcher.
(Multiple Choice)
4.9/5 (39)
SCENARIO 5-14
An accounting firm in a college town usually recruits employees from two of the universities in town.
This year, there are fifteen graduates from University A and five from University B and the firm
decides to hire six new employees from the two universities.
-Referring to Scenario 5-14, what is the probability that at least two of the new employees will be
from University B?
(Short Answer)
4.9/5 (38)
SCENARIO 5-11
There are two houses with almost identical characteristics available for investment in two different
neighborhoods with drastically different demographic composition. The anticipated gain in value
when the houses are sold in 10 years has the following probability distribution:
-Referring to Scenario 5-11, if you can invest 70% of your money on the house in neighborhood A
and the remaining on the house in neighborhood B, what is the portfolio risk of your investment?
(Short Answer)
4.7/5 (34)
SCENARIO 5-11
There are two houses with almost identical characteristics available for investment in two different
neighborhoods with drastically different demographic composition. The anticipated gain in value
when the houses are sold in 10 years has the following probability distribution:
-Referring to Scenario 5-11, if you can invest 90% of your money on the house in neighborhood A
and the remaining on the house in neighborhood B, what is the portfolio risk of your investment?
(Short Answer)
4.8/5 (38)
SCENARIO 16-16
Given below are the average prices for three types of energy products for five consecutive years. Year Electricity Natural Gas Fuel Oil 1 43.205 25.893 0.892 2 16.959 28.749 0.969 3 47.202 28.933 1.034 4 48.874 29.872 0.913 5 48.693 28.384 0.983
-Referring to Scenario 16-16, what are the simple price indices for electricity, natural gas and
fuel oil, respectively, in year 3 using year 5 as the base year?
(Short Answer)
4.8/5 (39)
SCENARIO 8-16
A random sample of 100 stores from a large chain of 500 garden supply stores was selected to
determine the mean number of lawnmowers sold at an end-of-season clearance sale. The sample
results indicated a mean of 6 and a standard deviation of 2 lawnmowers sold. A 95% confidence
interval (5.623 to 6.377) was established based on these results.
-Referring to Scenario 8-16, if the population had consisted of 1,000 stores, the
confidence interval estimate of the mean with finite population correction would have been wider
in range.
(True/False)
4.9/5 (32)
SCENARIO 4-17
Jake woke up late in the morning on the day that he has to go to school to take an important test. He
can either take the shuttle bus which is usually running late 20% of the time or ride his unreliable
motorcycle which breaks down 40% of the time. He decides to toss a fair coin to make his choice.
-Referring to Scenario 4-17, if Jake, in fact, gets to the test on time, what is the probability that he
rode his bike?
(Short Answer)
4.9/5 (32)
SCENARIO 11-12
A student team in a business statistics course designed an experiment to investigate whether the brand
of bubblegum used affected the size of bubbles they could blow. To reduce the person-to-person
variability, the students decided to use a randomized block design using themselves as blocks.
Four brands of bubblegum were tested. A student chewed two pieces of a brand of gum and then blew
a bubble, attempting to make it as big as possible. Another student measured the diameter of the
bubble at its biggest point. The following table gives the diameters of the bubbles (in inches) for the
16 observations. 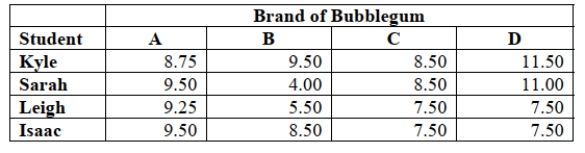 -Referring to Scenario 11-12, the decision made at a 0.05 level of significance on
the F test for the block effects implies that the blocking has been advantageous in reducing the
experiment error.
-Referring to Scenario 11-12, the decision made at a 0.05 level of significance on
the F test for the block effects implies that the blocking has been advantageous in reducing the
experiment error.
(True/False)
5.0/5 (32)
SCENARIO 16-17
Given below are the prices of a basket of four food items from 2008 to 2012. Year Wheat( \/ Bushel) Corn( \/ Bushel) Soybeans( \/ Bushel) Milk( \/ hundredweight) 2008 4.25 3.71 7.41 15.03 2009 3.43 2.7 7.55 13.63 2010 2.63 2.3 6.05 15.18 2011 2.11 1.97 4.68 14.72 2012 2.16 1.9 4.81 12.32
-Referring to Scenario 16-17, what are the simple price indices for wheat, corn, soybeans and
milk, respectively, in 2008 using 2012 as the base year?
(Short Answer)
4.7/5 (43)
SCENARIO 4-17
Jake woke up late in the morning on the day that he has to go to school to take an important test. He
can either take the shuttle bus which is usually running late 20% of the time or ride his unreliable
motorcycle which breaks down 40% of the time. He decides to toss a fair coin to make his choice.
-Referring to Scenario 4-17, if Jake, in fact, gets to the test on time, what is the probability that he
took the bus?
(Short Answer)
4.8/5 (36)
Filters
- Essay(0)
- Multiple Choice(0)
- Short Answer(0)
- True False(0)
- Matching(0)