Exam 20: Probability and Combinatorics
Exam 1: Defining and Collecting Data202 Questions
Exam 2: Organizing and Visualizing256 Questions
Exam 3: Numerical Descriptive Measures217 Questions
Exam 4: Basic Probability167 Questions
Exam 5: Discrete Probability Distributions165 Questions
Exam 6: The Normal Distribution and Other Continuous Distributions170 Questions
Exam 7: Sampling Distributions165 Questions
Exam 8: Confidence Interval Estimation219 Questions
Exam 9: Fundamentals of Hypothesis Testing: One-Sample Tests194 Questions
Exam 10: Two-Sample Tests240 Questions
Exam 11: Analysis of Variance170 Questions
Exam 12: Chi-Square and Nonparametric188 Questions
Exam 13: Simple Linear Regression243 Questions
Exam 14: Introduction to Multiple394 Questions
Exam 15: Multiple Regression146 Questions
Exam 16: Time-Series Forecasting235 Questions
Exam 17: Getting Ready to Analyze Data386 Questions
Exam 18: Statistical Applications in Quality Management159 Questions
Exam 19: Decision Making126 Questions
Exam 20: Probability and Combinatorics421 Questions
Select questions type
SCENARIO 11-13
An important factor in selecting database software is the time required for a user to learn how to use
the system. To evaluate three potential brands (A, B and C) of database software, a company
designed a test involving five different employees. To reduce variability due to differences among
employees, each of the five employees is trained on each of the three different brands. The amount of
time (in hours) needed to learn each of the three different brands is given below: Software Operator A B C 1 17 17 23 2 18 17 23 3 14 13 19 4 12 11 18 5 19 17 22 Mean 16 15 21
Source of Variation SS df MS F P-value Fcrit Rows 84.66667 4 21.16667 50.8 9.98-06 3.837853 Columns 103.3333 2 51.66667 124 9.54-07 4.45897 Error 3.333333 8 0.416667 Total 191.3333 14
-Referring to Scenario 11-13, what is the p-value of the F test statistic for testing the block effects?
(Short Answer)
4.9/5  (36)
(36)
SCENARIO 5-12
Two different designs on a new line of winter jackets for the coming winter are available for your
manufacturing plants. Your profit (in thousands of dollars) will depend on the taste of the consumers
when winter arrives. The probability of the three possible different tastes of the consumers and the
corresponding profits are presented in the following table. Probability Taste Design A Design B 0.2 more conservative 180 520 0.5 no change 230 310 0.3 more liberal 350 270
-Referring to Scenario 5-12, what is the covariance of the profits from the two different designs?
(Essay)
4.8/5 (37)
SCENARIO 16-17
Given below are the prices of a basket of four food items from 2008 to 2012. Year Wheat( \/ Bushel) Corn( \/ Bushel) Soybeans( \/ Bushel) Milk( \/ hundredweight) 2008 4.25 3.71 7.41 15.03 2009 3.43 2.7 7.55 13.63 2010 2.63 2.3 6.05 15.18 2011 2.11 1.97 4.68 14.72 2012 2.16 1.9 4.81 12.32
-Referring to Scenario 16-17, what is the Laspeyres price index for the basket of four food
items in 2012 that consisted of 50 bushels of wheat, 30 bushels of corn, 40 bushels of
soybeans and 80 hundredweight of milk in 2008 using 2008 as the base year?
(Short Answer)
4.9/5 (38)
SCENARIO 5-11
There are two houses with almost identical characteristics available for investment in two different
neighborhoods with drastically different demographic composition. The anticipated gain in value
when the houses are sold in 10 years has the following probability distribution: 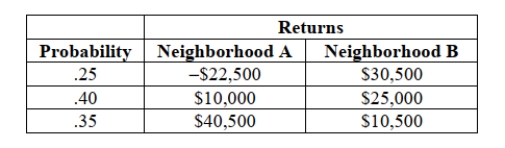 -Referring to Scenario 5-11, if you can invest 10% of your money on the house in neighborhood A
and the remaining on the house in neighborhood B, what is the portfolio expected return of your
investment?
-Referring to Scenario 5-11, if you can invest 10% of your money on the house in neighborhood A
and the remaining on the house in neighborhood B, what is the portfolio expected return of your
investment?
(Short Answer)
4.9/5 (34)
SCENARIO 11-13
An important factor in selecting database software is the time required for a user to learn how to use
the system. To evaluate three potential brands (A, B and C) of database software, a company
designed a test involving five different employees. To reduce variability due to differences among
employees, each of the five employees is trained on each of the three different brands. The amount of
time (in hours) needed to learn each of the three different brands is given below: Software Operator A B C 1 17 17 23 2 18 17 23 3 14 13 19 4 12 11 18 5 19 17 22 Mean 16 15 21
Source of Variation SS df MS F P-value Fcrit Rows 84.66667 4 21.16667 50.8 9.98-06 3.837853 Columns 103.3333 2 51.66667 124 9.54-07 4.45897 Error 3.333333 8 0.416667 Total 191.3333 14
-Referring to Scenario 11-13, what are the degrees of freedom of the F test statistic for testing the
block effects?
(Essay)
4.8/5 (35)
SCENARIO 16-16
Given below are the average prices for three types of energy products for five consecutive years. Year Electricity Natural Gas Fuel Oil 1 43.205 25.893 0.892 2 16.959 28.749 0.969 3 47.202 28.933 1.034 4 48.874 29.872 0.913 5 48.693 28.384 0.983
-Referring to Scenario 16-16, what is the unweighted aggregate price index for the group of
three energy items in year 3 using year 1 as the base year?
(Short Answer)
4.8/5 (25)
SCENARIO 16-16
Given below are the average prices for three types of energy products for five consecutive years. Year Electricity Natural Gas Fuel Oil 1 43.205 25.893 0.892 2 16.959 28.749 0.969 3 47.202 28.933 1.034 4 48.874 29.872 0.913 5 48.693 28.384 0.983
-Referring to Scenario 16-16, what is the unweighted aggregate price index for the group of
three energy items in year 4 using year 1 as the base year?
(Short Answer)
4.9/5 (36)
SCENARIO 11-13
An important factor in selecting database software is the time required for a user to learn how to use
the system. To evaluate three potential brands (A, B and C) of database software, a company
designed a test involving five different employees. To reduce variability due to differences among
employees, each of the five employees is trained on each of the three different brands. The amount of
time (in hours) needed to learn each of the three different brands is given below: Software Operator A B C 1 17 17 23 2 18 17 23 3 14 13 19 4 12 11 18 5 19 17 22 Mean 16 15 21
Source of Variation SS df MS F P-value Fcrit Rows 84.66667 4 21.16667 50.8 9.98-06 3.837853 Columns 103.3333 2 51.66667 124 9.54-07 4.45897 Error 3.333333 8 0.416667 Total 191.3333 14
-Referring to Scenario 11-13, there is evidence of a significant difference in the
mean amount of time needed to learn Brand A and Brand C at the 5% level of significance?
(True/False)
4.9/5 (30)
SCENARIO 16-16
Given below are the average prices for three types of energy products for five consecutive years. Year Electricity Natural Gas Fuel Oil 1 43.205 25.893 0.892 2 16.959 28.749 0.969 3 47.202 28.933 1.034 4 48.874 29.872 0.913 5 48.693 28.384 0.983
-Referring to Scenario 16-16, what are the simple price indices for electricity, natural gas and
fuel oil, respectively, in year 3 using year 1 as the base year?
(Short Answer)
5.0/5 (35)
SCENARIO 11-11
An agronomist wants to compare the crop yield of 3 varieties of chickpea seeds. She plants all 3
varieties of the seeds on each of 5 different patches of fields. She then measures the crop yield in
bushels per acre. Treating this as a randomized block design, the results are presented in the table that
follows. 1 11.1 19.0 14.6 2 13.5 18.0 15.7 3 15.3 19.8 16.8 4 14.6 19.6 16.7 5 9.8 16.6 15.2
-Referring to Scenario 11-11, the randomized block F test is valid only if the
population of crop yields has the same variance for the 3 varieties.
(True/False)
4.9/5 (31)
SCENARIO 5-12
Two different designs on a new line of winter jackets for the coming winter are available for your
manufacturing plants. Your profit (in thousands of dollars) will depend on the taste of the consumers
when winter arrives. The probability of the three possible different tastes of the consumers and the
corresponding profits are presented in the following table. Probability Taste Design A Design B 0.2 more conservative 180 520 0.5 no change 230 310 0.3 more liberal 350 270
-Referring to Scenario 5-12, if you decide to choose Design A for 10% of the production lines and
Design B for the remaining production lines, what is the expected profit?
(Short Answer)
4.8/5 (41)
SCENARIO 5-13
From an inventory of 48 new cars being shipped to local dealerships, corporate reports indicate that
12 have defective radios installed.
-Referring to Scenario 5-13, what is the probability out of the 8 new cars it just received that,
when each is tested, no more than half of the cars have non-defective radios?
(Short Answer)
4.9/5 (26)
SCENARIO 11-11
An agronomist wants to compare the crop yield of 3 varieties of chickpea seeds. She plants all 3
varieties of the seeds on each of 5 different patches of fields. She then measures the crop yield in
bushels per acre. Treating this as a randomized block design, the results are presented in the table that
follows. 1 11.1 19.0 14.6 2 13.5 18.0 15.7 3 15.3 19.8 16.8 4 14.6 19.6 16.7 5 9.8 16.6 15.2
-Referring to Scenario 11-11, what is the value of the F test statistic for testing the block effects?
(Short Answer)
4.9/5 (41)
A professor computed the sample average exam score of 20 students and used it to
estimate the average exam score of the 1,500 students taking the exam. This is an example of
inferential statistics.
(True/False)
4.9/5 (39)
The covariance between two investments is equal to the sum of the variances of the
investments.
(True/False)
4.9/5 (36)
SCENARIO 12-21
A filling machine at a local soft drinks company is calibrated to fill the cans at a mean amount of 12
fluid ounces and a standard deviation of 0.5 ounces. The company wants to test whether the standard
deviation of the amount filled by the machine is 0.5 ounces. A random sample of 15 cans filled by
the machine reveals a standard deviation of 0.67 ounces.
-Referring to Scenario 12-21, there is sufficient evidence to conclude that the
standard deviation of the amount filled by the machine is not exactly 0.5 ounces when using a 5%
level of significance.
(True/False)
4.9/5 (35)
SCENARIO 5-13
From an inventory of 48 new cars being shipped to local dealerships, corporate reports indicate that
12 have defective radios installed.
-Referring to Scenario 5-13, what is the probability out of the 8 new cars it just received that,
when each is tested, no more than half of the cars have defective radios?
(Short Answer)
4.9/5 (43)
The interval between patients arriving at an outpatient clinic follows an exponential distribution
at a rate of 1 patient per hour. What is the probability that a randomly chosen arrival to be less
than 20 minutes?
(Short Answer)
4.8/5 (40)
SCENARIO 5-12
Two different designs on a new line of winter jackets for the coming winter are available for your
manufacturing plants. Your profit (in thousands of dollars) will depend on the taste of the consumers
when winter arrives. The probability of the three possible different tastes of the consumers and the
corresponding profits are presented in the following table. Probability Taste Design A Design B 0.2 more conservative 180 520 0.5 no change 230 310 0.3 more liberal 350 270
-Referring to Scenario 5-12, if you decide to choose Design A for 10% of the production lines and
Design B for the remaining production lines, what is the coefficient of variation of your
investment?
(Short Answer)
4.9/5 (39)
Filters
- Essay(0)
- Multiple Choice(0)
- Short Answer(0)
- True False(0)
- Matching(0)