Exam 20: Probability and Combinatorics
Exam 1: Defining and Collecting Data202 Questions
Exam 2: Organizing and Visualizing256 Questions
Exam 3: Numerical Descriptive Measures217 Questions
Exam 4: Basic Probability167 Questions
Exam 5: Discrete Probability Distributions165 Questions
Exam 6: The Normal Distribution and Other Continuous Distributions170 Questions
Exam 7: Sampling Distributions165 Questions
Exam 8: Confidence Interval Estimation219 Questions
Exam 9: Fundamentals of Hypothesis Testing: One-Sample Tests194 Questions
Exam 10: Two-Sample Tests240 Questions
Exam 11: Analysis of Variance170 Questions
Exam 12: Chi-Square and Nonparametric188 Questions
Exam 13: Simple Linear Regression243 Questions
Exam 14: Introduction to Multiple394 Questions
Exam 15: Multiple Regression146 Questions
Exam 16: Time-Series Forecasting235 Questions
Exam 17: Getting Ready to Analyze Data386 Questions
Exam 18: Statistical Applications in Quality Management159 Questions
Exam 19: Decision Making126 Questions
Exam 20: Probability and Combinatorics421 Questions
Select questions type
SCENARIO 4-13
A survey is taken among customers of a fast-food restaurant to determine preference for hamburger or
chicken. Of 200 respondents selected, 75 were children and 125 were adults. 120 preferred hamburger
and 80 preferred chicken. 55 of the children preferred hamburger.
-Referring to Scenario 4-13, assume we know that a person prefers chicken. The probability that
this individual is an adult is __________.
(Short Answer)
4.9/5  (30)
(30)
The Paasche price index has the disadvantage that current consumption
quantities are usually hard to obtain.
(True/False)
4.8/5 (38)
SCENARIO 11-13
An important factor in selecting database software is the time required for a user to learn how to use
the system. To evaluate three potential brands (A, B and C) of database software, a company
designed a test involving five different employees. To reduce variability due to differences among
employees, each of the five employees is trained on each of the three different brands. The amount of
time (in hours) needed to learn each of the three different brands is given below: Software Operator A B C 1 17 17 23 2 18 17 23 3 14 13 19 4 12 11 18 5 19 17 22 Mean 16 15 21
Source of Variation SS df MS F P-value Fcrit Rows 84.66667 4 21.16667 50.8 9.98-06 3.837853 Columns 103.3333 2 51.66667 124 9.54-07 4.45897 Error 3.333333 8 0.416667 Total 191.3333 14
-Referring to Scenario 11-13, the randomized block F test is valid only if the
population of the amount of time needed has the same variance for the 3 brands.
(True/False)
4.9/5 (34)
The Commissioner of Health in New York State wanted to study malpractice litigation in New
York. A sample of 31 thousand medical records was drawn from a population of 2.7 million
patients who were discharged during 2010. The collection, presentation, and characterization of
the data from patient medical records are examples of _______.
(Short Answer)
4.8/5 (42)
SCENARIO 6-8
A company has 125 personal computers. The probability that any one of them will require repair on a
given day is 0.15.
-Referring to Scenario 6-8 and assuming that the number of computers that requires repair on a
given day follows a binomial distribution, compute the probability that there will be less than 8
computers that require repair on a given day using a normal approximation.
(Short Answer)
5.0/5 (38)
The McNemar test is approximately distributed as a standardized normal random
variable.
(True/False)
4.8/5 (46)
The Paasche price index reflects more accurately the consumption cost at a
point in time because it uses the consumption quantities in the initial year as the base.
(True/False)
4.8/5 (38)
SCENARIO 16-16
Given below are the average prices for three types of energy products for five consecutive years. Year Electricity Natural Gas Fuel Oil 1 43.205 25.893 0.892 2 16.959 28.749 0.969 3 47.202 28.933 1.034 4 48.874 29.872 0.913 5 48.693 28.384 0.983
-Referring to Scenario 16-16, what is the Laspeyres price index for the group of three energy
items in year 3 for a family that consumed 15 units of electricity, 24 units of natural gas and
200 units of fuel oil in year 1 using year 1 as the base year?
(Short Answer)
4.7/5 (39)
SCENARIO 9-12
A drug company is considering marketing a new local anesthetic. The effective time of the anesthetic
the drug company is currently producing has a normal distribution with a mean of 7.4 minutes with a
standard deviation of 1.2 minutes. The chemistry of the new anesthetic is such that the effective time
should be normally distributed with the same standard deviation. The company will market the new
local anesthetic as being better if there is evidence that the population mean effective time is greater
than the 7.4 minutes of the current local anesthetic.
-Referring to Scenario 9-12, if you select a sample of 25 new local anesthetics and are willing to
have a level of significance of 0.1, the probability of a Type I error is _____ if the population
mean effective time is 8 minutes.
(Short Answer)
4.7/5 (42)
SCENARIO 11-11
An agronomist wants to compare the crop yield of 3 varieties of chickpea seeds. She plants all 3
varieties of the seeds on each of 5 different patches of fields. She then measures the crop yield in
bushels per acre. Treating this as a randomized block design, the results are presented in the table that
follows. 1 11.1 19.0 14.6 2 13.5 18.0 15.7 3 15.3 19.8 16.8 4 14.6 19.6 16.7 5 9.8 16.6 15.2
-Referring to Scenario 11-11, the agronomist decided to perform a randomized block F test for the
difference in the means. The amount of total variation or SST is __________.
(Short Answer)
4.8/5 (37)
SCENARIO 8-14
The president of a university is concerned that the percentage of students who have cheated on an
exam is higher than the 1% acceptable level. A confidential random sample of 1,000 students from a
population of 7,000 revealed that 6 of them said that they had cheated on an exam during the last
semester.
-Referring to Scenario 8-14, using the 90% one-sided confidence interval, the
superintendent can be 85% confident that no more than 1% of the students at the university had
cheated on an exam during the last semester.
(True/False)
4.8/5 (34)
SCENARIO 11-13
An important factor in selecting database software is the time required for a user to learn how to use
the system. To evaluate three potential brands (A, B and C) of database software, a company
designed a test involving five different employees. To reduce variability due to differences among
employees, each of the five employees is trained on each of the three different brands. The amount of
time (in hours) needed to learn each of the three different brands is given below: Software Operator A B C 1 17 17 23 2 18 17 23 3 14 13 19 4 12 11 18 5 19 17 22 Mean 16 15 21
Source of Variation SS df MS F P-value Fcrit Rows 84.66667 4 21.16667 50.8 9.98-06 3.837853 Columns 103.3333 2 51.66667 124 9.54-07 4.45897 Error 3.333333 8 0.416667 Total 191.3333 14
-Referring to Scenario 11-13, what is the critical value of the randomized block F test for the
difference in the means at a level of significance of 0.05?
(Short Answer)
4.7/5 (38)
SCENARIO 9-14
An appliance manufacturer claims to have developed a compact microwave oven that consumes a
population mean of no more than 250 W. From previous studies, it is believed that power
consumption for microwave ovens is normally distributed with a population standard deviation of 15
W. If there is evidence that the population mean consumption is greater than 250 W, the manufacturer
will be unable to make the claim.
-Referring to Scenario 9-14, if you select a sample of 20 compact microwave ovens and are
willing to have a level of significance of 0.05, the power of the test is _____ if the mean power
consumption of all such microwave ovens is in fact 248 W.
(Short Answer)
4.8/5 (38)
SCENARIO 16-17
Given below are the prices of a basket of four food items from 2008 to 2012. Year Wheat( \/ Bushel) Corn( \/ Bushel) Soybeans( \/ Bushel) Milk( \/ hundredweight) 2008 4.25 3.71 7.41 15.03 2009 3.43 2.7 7.55 13.63 2010 2.63 2.3 6.05 15.18 2011 2.11 1.97 4.68 14.72 2012 2.16 1.9 4.81 12.32
-Referring to Scenario 16-17, what are the simple price indices for wheat, corn, soybeans and
milk, respectively, in 2010 using 2008 as the base year?
(Short Answer)
4.8/5 (34)
SCENARIO 12-21
A filling machine at a local soft drinks company is calibrated to fill the cans at a mean amount of 12
fluid ounces and a standard deviation of 0.5 ounces. The company wants to test whether the standard
deviation of the amount filled by the machine is 0.5 ounces. A random sample of 15 cans filled by
the machine reveals a standard deviation of 0.67 ounces.
-Referring to Scenario 12-21, which is the appropriate test to use?
(Multiple Choice)
4.8/5 (35)
SCENARIO 9-14
An appliance manufacturer claims to have developed a compact microwave oven that consumes a
population mean of no more than 250 W. From previous studies, it is believed that power
consumption for microwave ovens is normally distributed with a population standard deviation of 15
W. If there is evidence that the population mean consumption is greater than 250 W, the manufacturer
will be unable to make the claim.
-Referring to Scenario 9-14, if you select a sample of 20 compact microwave ovens and are
willing to have a level of significance of 0.01, the power of the test is _____ if the mean power
consumption of all such microwave ovens is in fact 248 W.
(Short Answer)
4.9/5 (47)
SCENARIO 5-12
Two different designs on a new line of winter jackets for the coming winter are available for your
manufacturing plants. Your profit (in thousands of dollars) will depend on the taste of the consumers
when winter arrives. The probability of the three possible different tastes of the consumers and the
corresponding profits are presented in the following table. Probability Taste Design A Design B 0.2 more conservative 180 520 0.5 no change 230 310 0.3 more liberal 350 270
-Referring to Scenario 5-12, if you decide to choose Design A for 10% of the production lines and
Design B for the remaining production lines, what is the risk of your investment?
(Short Answer)
4.9/5 (35)
The number of males selected in a sample of 5 students taken without replacement
from a class of 9 females and 18 males has a binomial distribution.
(True/False)
4.8/5 (29)
SCENARIO 5-12
Two different designs on a new line of winter jackets for the coming winter are available for your
manufacturing plants. Your profit (in thousands of dollars) will depend on the taste of the consumers
when winter arrives. The probability of the three possible different tastes of the consumers and the
corresponding profits are presented in the following table. Probability Taste Design A Design B 0.2 more conservative 180 520 0.5 no change 230 310 0.3 more liberal 350 270
-Referring to Scenario 5-12, what is the expected profit if you increase the shift of your production
lines and choose to produce both designs?
(Short Answer)
4.9/5 (35)
SCENARIO 11-12
A student team in a business statistics course designed an experiment to investigate whether the brand
of bubblegum used affected the size of bubbles they could blow. To reduce the person-to-person
variability, the students decided to use a randomized block design using themselves as blocks.
Four brands of bubblegum were tested. A student chewed two pieces of a brand of gum and then blew
a bubble, attempting to make it as big as possible. Another student measured the diameter of the
bubble at its biggest point. The following table gives the diameters of the bubbles (in inches) for the
16 observations. 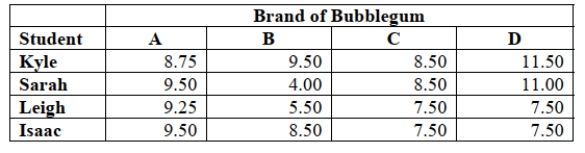 -Referring to Scenario 11-12, the randomized block F test is valid only if the
population of diameters has the same variance for the 4 brands.
-Referring to Scenario 11-12, the randomized block F test is valid only if the
population of diameters has the same variance for the 4 brands.
(True/False)
4.8/5 (41)
Filters
- Essay(0)
- Multiple Choice(0)
- Short Answer(0)
- True False(0)
- Matching(0)