Exam 20: Probability and Combinatorics
Exam 1: Defining and Collecting Data202 Questions
Exam 2: Organizing and Visualizing256 Questions
Exam 3: Numerical Descriptive Measures217 Questions
Exam 4: Basic Probability167 Questions
Exam 5: Discrete Probability Distributions165 Questions
Exam 6: The Normal Distribution and Other Continuous Distributions170 Questions
Exam 7: Sampling Distributions165 Questions
Exam 8: Confidence Interval Estimation219 Questions
Exam 9: Fundamentals of Hypothesis Testing: One-Sample Tests194 Questions
Exam 10: Two-Sample Tests240 Questions
Exam 11: Analysis of Variance170 Questions
Exam 12: Chi-Square and Nonparametric188 Questions
Exam 13: Simple Linear Regression243 Questions
Exam 14: Introduction to Multiple394 Questions
Exam 15: Multiple Regression146 Questions
Exam 16: Time-Series Forecasting235 Questions
Exam 17: Getting Ready to Analyze Data386 Questions
Exam 18: Statistical Applications in Quality Management159 Questions
Exam 19: Decision Making126 Questions
Exam 20: Probability and Combinatorics421 Questions
Select questions type
Using the number of registered voters who turned out to vote for the primary in
Iowa to predict the number of registered voters who will turn out to vote in Vermont's primary is
an example of descriptive statistics.
(True/False)
4.9/5  (39)
(39)
SCENARIO 4-15
At a Texas college, 60% of the students are from the southern part of the state, 30% are from the
northern part of the state, and the remaining 10% are from out-of-state. All students must take and
pass an Entry Level Math (ELM) test. 60% of the southerners have passed the ELM, 70% of the
northerners have passed the ELM, and 90% of the out-of-staters have passed the ELM.
-Referring to Scenario 4-15, if a randomly selected student has not passed the ELM, the
probability the student is from southern Texas is ________.
(Short Answer)
4.8/5 (33)
SCENARIO 9-13
A manufacturer produces light bulbs that have a mean life of at least 500 hours when the production
process is working properly. Based on past experience, the population standard deviation is 50 hours
and the light bulb life is normally distributed. The operations manager stops the production process if
there is evidence that the population mean light bulb life is below 500 hours.
-Referring to Scenario 9-13, if you select a sample of 100 light bulbs and are willing to have a
level of significance of 0.10, the power of the test is _____ if the population mean bulb life is 490
hours.
(Short Answer)
4.8/5 (34)
SCENARIO 9-12
A drug company is considering marketing a new local anesthetic. The effective time of the anesthetic
the drug company is currently producing has a normal distribution with a mean of 7.4 minutes with a
standard deviation of 1.2 minutes. The chemistry of the new anesthetic is such that the effective time
should be normally distributed with the same standard deviation. The company will market the new
local anesthetic as being better if there is evidence that the population mean effective time is greater
than the 7.4 minutes of the current local anesthetic.
-Referring to Scenario 9-12, if you select a sample of 25 new local anesthetics and are willing to
have a level of significance of 0.01, the probability of the company incorrectly marketing the new
local anesthetic when its population mean effective time is not greater than the 7.4 minutes is
_____.
(Short Answer)
4.8/5 (42)
SCENARIO 5-12
Two different designs on a new line of winter jackets for the coming winter are available for your
manufacturing plants. Your profit (in thousands of dollars) will depend on the taste of the consumers
when winter arrives. The probability of the three possible different tastes of the consumers and the
corresponding profits are presented in the following table. Probability Taste Design A Design B 0.2 more conservative 180 520 0.5 no change 230 310 0.3 more liberal 350 270
-Referring to Scenario 5-12, if your investment preference is to minimize the amount of risk that
you have to take and do not care at all about the expected profit, will you choose a production
mix that will consist of 10%, 30%, 50%, 70%, or 90% of your production lines for Design A and
the remaining for Design B?
(Short Answer)
4.9/5 (34)
A debate team of 4 members for a high school will be chosen randomly from a potential group of
15 students. Ten of the 15 students have no prior competition experience while the others have
some degree of experience. What is the probability that none of the members chosen for the team
have any competition experience?
(Short Answer)
4.9/5 (35)
SCENARIO 11-12
A student team in a business statistics course designed an experiment to investigate whether the brand
of bubblegum used affected the size of bubbles they could blow. To reduce the person-to-person
variability, the students decided to use a randomized block design using themselves as blocks.
Four brands of bubblegum were tested. A student chewed two pieces of a brand of gum and then blew
a bubble, attempting to make it as big as possible. Another student measured the diameter of the
bubble at its biggest point. The following table gives the diameters of the bubbles (in inches) for the
16 observations. 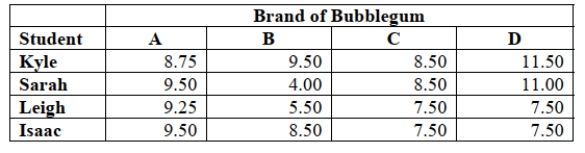 -Referring to Scenario 11-12, what is the critical value of the randomized block F test for the
difference in the means at a level of significance of 0.05?
-Referring to Scenario 11-12, what is the critical value of the randomized block F test for the
difference in the means at a level of significance of 0.05?
(Short Answer)
4.9/5 (33)
SCENARIO 11-12
A student team in a business statistics course designed an experiment to investigate whether the brand
of bubblegum used affected the size of bubbles they could blow. To reduce the person-to-person
variability, the students decided to use a randomized block design using themselves as blocks.
Four brands of bubblegum were tested. A student chewed two pieces of a brand of gum and then blew
a bubble, attempting to make it as big as possible. Another student measured the diameter of the
bubble at its biggest point. The following table gives the diameters of the bubbles (in inches) for the
16 observations.
-Referring to Scenario 11-12, what is the p-value of the test statistic for the randomized block F
test for the difference in the means?
(Short Answer)
4.9/5 (34)
SCENARIO 9-14
An appliance manufacturer claims to have developed a compact microwave oven that consumes a
population mean of no more than 250 W. From previous studies, it is believed that power
consumption for microwave ovens is normally distributed with a population standard deviation of 15
W. If there is evidence that the population mean consumption is greater than 250 W, the manufacturer
will be unable to make the claim.
-Referring to Scenario 9-14, if you select a sample of 20 compact microwave ovens and are
willing to have a level of significance of 0.10, the power of the test is _____ if the mean power
consumption of all such microwave ovens is in fact 248 W.
(Short Answer)
4.7/5 (35)
SCENARIO 5-14
An accounting firm in a college town usually recruits employees from two of the universities in town.
This year, there are fifteen graduates from University A and five from University B and the firm
decides to hire six new employees from the two universities.
-Referring to Scenario 5-14, what is the probability that all six of the new employees will be from
University A?
(Short Answer)
4.9/5 (33)
A debate team of 4 members for a high school will be chosen randomly from a potential group of
15 students. Ten of the 15 students have no prior competition experience while the others have
some degree of experience. What is the probability that at least 1 of the members chosen for the
team have some prior competition experience?
(Short Answer)
4.8/5 (37)
SCENARIO 11-12
A student team in a business statistics course designed an experiment to investigate whether the brand
of bubblegum used affected the size of bubbles they could blow. To reduce the person-to-person
variability, the students decided to use a randomized block design using themselves as blocks.
Four brands of bubblegum were tested. A student chewed two pieces of a brand of gum and then blew
a bubble, attempting to make it as big as possible. Another student measured the diameter of the
bubble at its biggest point. The following table gives the diameters of the bubbles (in inches) for the
16 observations.
-Referring to Scenario 11-12, the amount of total variation or SST is __________.
(Short Answer)
4.9/5 (31)
SCENARIO 8-13
The president of a university is concerned that illicit drug use on campus is higher than the 5%
targeted level. A random sample of 250 students from a population of 2,000 revealed that 7 of them
had used illicit drugs during the last 12 months.
-Referring to Scenario 8-13, what is the upper bound of the 90% one-sided confidence interval for the
proportion of students who had used illicit drugs during the last 12 months?
(Short Answer)
4.7/5 (37)
SCENARIO 5-12
Two different designs on a new line of winter jackets for the coming winter are available for your
manufacturing plants. Your profit (in thousands of dollars) will depend on the taste of the consumers
when winter arrives. The probability of the three possible different tastes of the consumers and the
corresponding profits are presented in the following table. Probability Taste Design A Design B 0.2 more conservative 180 520 0.5 no change 230 310 0.3 more liberal 350 270
-Referring to Scenario 5-12 if you decide to choose Design A for 90% of the production lines and
Design B for the remaining production lines, what is the risk of your investment?
(Short Answer)
4.8/5 (39)
SCENARIO 11-12
A student team in a business statistics course designed an experiment to investigate whether the brand
of bubblegum used affected the size of bubbles they could blow. To reduce the person-to-person
variability, the students decided to use a randomized block design using themselves as blocks.
Four brands of bubblegum were tested. A student chewed two pieces of a brand of gum and then blew
a bubble, attempting to make it as big as possible. Another student measured the diameter of the
bubble at its biggest point. The following table gives the diameters of the bubbles (in inches) for the
16 observations.
-Referring to Scenario 11-12, the among-group variation or SSA is __________.
(Short Answer)
4.8/5 (30)
SCENARIO 5-12
Two different designs on a new line of winter jackets for the coming winter are available for your
manufacturing plants. Your profit (in thousands of dollars) will depend on the taste of the consumers
when winter arrives. The probability of the three possible different tastes of the consumers and the
corresponding profits are presented in the following table. Probability Taste Design A Design B 0.2 more conservative 180 520 0.5 no change 230 310 0.3 more liberal 350 270
-Referring to Scenario 5-12 if you decide to choose Design A for 70% of the production lines and
Design B for the remaining production lines, what is the risk of your investment?
(Short Answer)
4.7/5 (38)
Twelve students in a Business Statistics class are to be formed into three teams of four. How
many different ways can this be done?
(Short Answer)
4.8/5 (45)
SCENARIO 11-13
An important factor in selecting database software is the time required for a user to learn how to use
the system. To evaluate three potential brands (A, B and C) of database software, a company
designed a test involving five different employees. To reduce variability due to differences among
employees, each of the five employees is trained on each of the three different brands. The amount of
time (in hours) needed to learn each of the three different brands is given below: Software Operator A B C 1 17 17 23 2 18 17 23 3 14 13 19 4 12 11 18 5 19 17 22 Mean 16 15 21
Source of Variation SS df MS F P-value Fcrit Rows 84.66667 4 21.16667 50.8 9.98-06 3.837853 Columns 103.3333 2 51.66667 124 9.54-07 4.45897 Error 3.333333 8 0.416667 Total 191.3333 14
-Referring to Scenario 11-13, the decision made at a 0.05 level of significance on
the F test for the block effects implies that the blocking has been advantageous in reducing the
experiment error.
(True/False)
4.8/5 (34)
SCENARIO 16-17
Given below are the prices of a basket of four food items from 2008 to 2012. Year Wheat( \/ Bushel) Corn( \/ Bushel) Soybeans( \/ Bushel) Milk( \/ hundredweight) 2008 4.25 3.71 7.41 15.03 2009 3.43 2.7 7.55 13.63 2010 2.63 2.3 6.05 15.18 2011 2.11 1.97 4.68 14.72 2012 2.16 1.9 4.81 12.32
-Referring to Scenario 16-17, what is the Paasche price index for the basket of four food items
in 2011 that consisted of 60 bushels of wheat, 40 bushels of corn, 35 bushels of soybeans and
70 hundredweight of milk in 2011 using 2008 as the base year?
(Short Answer)
4.7/5 (33)
The more expensive commodities are overly influential in an unweighted
aggregate price index.
(True/False)
4.8/5 (31)
Filters
- Essay(0)
- Multiple Choice(0)
- Short Answer(0)
- True False(0)
- Matching(0)