Exam 9: Hypothesis Tests for One Population Mean
Exam 1: The Nature of Statistics88 Questions
Exam 2: Organizing Data169 Questions
Exam 3: Descriptive Measures195 Questions
Exam 4: Probability Concepts133 Questions
Exam 5: Discrete Random Variables163 Questions
Exam 6: The Normal Distribution144 Questions
Exam 7: The Sampling Distribution of the Sample Mean76 Questions
Exam 8: Confidence Intervals for One Population Mean84 Questions
Exam 9: Hypothesis Tests for One Population Mean58 Questions
Exam 10: Inferences for Two Population Means103 Questions
Exam 11: Inferences for Population Standard Deviations101 Questions
Exam 12: Inferences for Population Proportions104 Questions
Exam 13: Chi-Square Procedures74 Questions
Exam 14: Descriptive Methods in Regression and Correlation55 Questions
Exam 15: Inferential Methods in Regression and Correlation41 Questions
Exam 16: Analysis of Variance Anova71 Questions
Select questions type
Solve the problem. Use the critical-value approach.
-A sheet-metal press stamps out bolt washers with a nominal inner diameter of 0.25 inches. Measurement of the inner diameters of a random sample of 14 washers produced the following Results (in inches):
0.253 0.251 0.253 0.251 0.264 0.252 0.259 0.252 0.264 0.263 0.253 0.268 0.266 0.268
The normal scores of the data are summarized below:  Using technology, perform the following hypothesis test: at the significance level, determine whether the mean washer diameter for this machine exceeds the nominal value. Comment on the appropriateness of the test.
(Multiple Choice)
4.8/5  (38)
(38)
Construct a graph portraying the decision criterion for the specified hypothesis test.
-In tests of a computer component, it is found that the mean time between failures is 520 hours. A modification is made which is supposed to increase the time between failures. Tests on a random sample of 10 modified components resulted in the following times (in hours)between failures. 518 548 561 523 536 499 538 557 528 563 At the 5% significance level, test the claim that for the modified components, the mean time between failures is greater than 520 hours.
(Essay)
4.8/5 (47)
Describe parametric and nonparametric tests. Explain why nonparametric tests are important.
(Essay)
4.8/5 (37)
Preliminary data analyses indicate that it is reasonable to use a t-test to carry out the specified hypothesis test. Performthe t-test using the P-value approach.
-A large software company gives job applicants a test of programming ability and the mean for that test has been 160 in the past. Twenty-five job applicants are randomly selected from a large university and they produce a mean score of 183 with a standard deviation of 12. Use a 0.05 level of significance to test whether the mean score for students from this university is greater than 160.
(Essay)
4.9/5 (39)
Two graphical displays are given for a set of data. A hypothesis test is to be performed for the mean of the populationfrom which the data were obtained. Would it be reasonable to use a one-mean z-test? Explain your reasoning. Assumethat the population standard deviation is known.
-A normal probability plot and a histogram plot of the data are given below. 
(Essay)
4.9/5 (39)
Solve the problem. Use the critical-value approach.
-A machine that fills soda bottles is supposed to fill them to a mean volume of 16.2 fluid ounces. A random sample of 20 filled bottles produced the following volumes in fluid ounces: 16.3 15.9 16.7 15.3 17.1 16.4 3.9 15.9 16.2 3.4 16.4 8.2 15.5 16.5 16.0 16.3 15.8 16.7 16.5 15.5 These data are summarized on the following histogram:
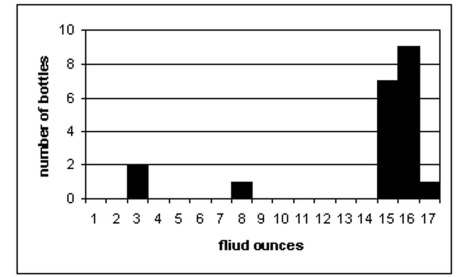 Using technology, perform the following hypothesis test: at the 5% significance level,determine Whether the fill volume is less than the supposed value. Comment on the appropriateness of the Test.
(Multiple Choice)
4.9/5 (27)
Perform a hypothesis test for the population mean. Assume that preliminary data analyses indicate that it is reasonable to apply the z-test. Use the critical-value approach.
-A hypothesis test for a population mean is conducted. The hypotheses are: :\mu= :\mu< The significance level is 0.08 and the critical value is -1.41. Sketch a normal curve displaying the decision criterion. This curve will represent the normal curve for the test statistic under the assumption that the null hypothesis is true. On your graph indicate the area in the tail, the critical value, the rejection region, and the nonrejection region.
(Essay)
4.9/5 (33)
Preliminary data analyses indicate that it is reasonable to use a t-test to carry out the specified hypothesis test. Performthe t-test using the P-value approach.
-A car manufacturer, Swanson, claims that the mean lifetime of one of its car engines is greater than 220,000 miles, which is the mean lifetime of the engine of a competitor. The mean lifetime for a random sample of 23 of the Swanson engines was miles with a standard deviation, s, of 11,500 miles. Test the Swanson's claim using a significance level of .
(Essay)
4.9/5 (39)
Perform a hypothesis test for the population mean. Assume that preliminary data analyses indicate that it is reasonable toapply the z-test. Use the critical-value approach.
-A car insurance company has determined that the mean annual car insurance cost for a family in the town of Watlington is $1716. A researcher wants to perform a hypothesis test to determine whether the mean insurance cost for a family in the town of Putford is higher than this. The mean insurance cost for a random sample of 32 families in Putford was $1761. At the 10% significance level, do the data provide sufficient evidence to conclude that the mean insurance cost for a family in Putford is higher than $1716, the mean cost for a family in Watlington.? Assume that the population standard deviation is $35.50.
(Essay)
4.9/5 (37)
Preliminary data analyses indicate that it is reasonable to use a t-test to carry out the specified hypothesis test. Performthe t-test using the P-value approach.
-In tests of a computer component, it is found that the mean time between failures is 520 hours. A modification is made which is supposed to increase the time between failures. Tests on a random sample of 10 modified components resulted in the following times (in hours)between failures. 518 548 561 523 536 499 538 557 528 563
At the 0.05 significance level, test the claim that for the modified components, the mean time between failures is greater than 520 hours.
(Essay)
4.9/5 (37)
Two graphical displays are given for a set of data. A hypothesis test is to be performed for the mean of the populationfrom which the data were obtained. Would it be reasonable to use a one-mean z-test? Explain your reasoning. Assumethat the population standard deviation is known.
-A normal probability plot and a stem-and-leaf diagram of the data are given below. 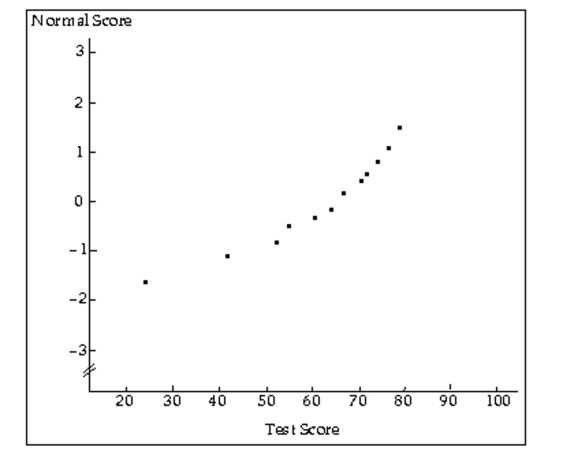 2 4 3 4 2 5 25 6 057 7 12579
(Essay)
4.8/5 (43)
Jenny is conducting a hypothesis test concerning a population mean. The hypotheses are as follows.
:\mu=50 :\mu>50
She selects a sample and finds that the sample mean is . She then does some calculations and is able to make the following statement: If were true, the chance that the sample mean would have come out as big ( or bigger) than is . Do you think that she should reject the null hypothesis? Why or why not?
(Essay)
4.8/5 (38)
A hypothesis testing situation is given. The population standard deviation, sample size, and significance level are given.Complete the table to give the probability of a Type II error and the power for each of the given values of µ. Use the table to draw the power curve.
-In 1990, the average math SAT score for students at one school was 472. Five years later, a teacher wants to perform a hypothesis test to determine whether the average SAT score of students at the school has changed from the 1990 mean of 472. Preliminary data analyses indicate that it is reasonable to apply a z-test. The hypotheses are :\mu=472 :\mu472. Assume that , and the significance level is . Find the probability of a Type II error and the power for .  430 440 450 460 470 474 484 494 504 514 520
(Essay)
4.8/5 (41)
Perform a hypothesis test for the population mean. Assume that preliminary data analyses indicate that it is reasonable toapply the z-test. Use the critical-value approach.
-A manufacturer makes steel bars that are supposed to have a mean length of 50 cm. A retailer suspects that the bars are running too long. A sample of 37 bars is taken and their mean length is determined to be 51 cm. Using a 1% level of significance, perform a hypothesis test to determine whether the population mean is greater than 50 cm. Assume that the population standard deviation is 3.6 cm.
(Essay)
4.8/5 (44)
Perform a hypothesis test for the population mean. Assume that preliminary data analyses indicate that it is reasonable to apply the z-test. Use the critical-value approach.
-In tests of a computer component, it is found that the mean time between failures is 983 hours. A modification is made which is supposed to increase reliability by increasing the time between failures. Tests on a sample of 36 modified components produce a mean time between failures of 983 hours. Using a 1% level of significance, perform a hypothesis test to determine whether the mean time between failures for the modified components is greater than 937 hours. Assume that the population standard deviation is 52 hours.
(Essay)
4.9/5 (42)
Provide an appropriate response.
-A hypothesis test is performed at the 5% significance level to determine whether the mean body temperature for a certain population differs from 37.1° C.
The hypotheses are
:\mu=37. :\mu37..
Explain the difference between statistical significance and practical significance.
(Essay)
4.7/5 (36)
Provide an appropriate response.
-For a fixed sample size, how will increasing the significance level of a hypothesis test affect the probability of a Type I error? How will it affect the probability of a Type II error?
(Essay)
4.9/5 (41)
Preliminary data analyses indicate that it is reasonable to use a t-test to carry out the specified hypothesis test. Performthe t-test using the P-value approach.
-A test of sobriety involves measuring a subject's motor skills. The mean score for men who are sober is known to be 35.0. A researcher would like to perform a hypothesis test to determine whether the mean score for sober women differs from 35.0. Twenty randomly selected sober women take the test and produce a mean score of 41.0 with a standard deviation of 3.7. Perform the hypothesis test at the 0.01 level of significance.
(Essay)
4.9/5 (32)
Filters
- Essay(0)
- Multiple Choice(0)
- Short Answer(0)
- True False(0)
- Matching(0)