Exam 9: Hypothesis Tests for One Population Mean
Exam 1: The Nature of Statistics88 Questions
Exam 2: Organizing Data169 Questions
Exam 3: Descriptive Measures195 Questions
Exam 4: Probability Concepts133 Questions
Exam 5: Discrete Random Variables163 Questions
Exam 6: The Normal Distribution144 Questions
Exam 7: The Sampling Distribution of the Sample Mean76 Questions
Exam 8: Confidence Intervals for One Population Mean84 Questions
Exam 9: Hypothesis Tests for One Population Mean58 Questions
Exam 10: Inferences for Two Population Means103 Questions
Exam 11: Inferences for Population Standard Deviations101 Questions
Exam 12: Inferences for Population Proportions104 Questions
Exam 13: Chi-Square Procedures74 Questions
Exam 14: Descriptive Methods in Regression and Correlation55 Questions
Exam 15: Inferential Methods in Regression and Correlation41 Questions
Exam 16: Analysis of Variance Anova71 Questions
Select questions type
Preliminary data analyses indicate that it is reasonable to use a t-test to carry out the specified hypothesis test. Performthe t-test using the critical-value approach.
-Use a significance level to test the claim that . The sample data consists of 9 scores for which and .
(Essay)
4.7/5  (34)
(34)
Provide an appropriate response.
-Suppose that you want to perform a hypothesis test for a population mean. Give an example of a situation in which both the z-test and the Wilcoxon signed-rank test are permissible but the Wilcoxon signed-rank test is preferable. Specify the distribution of the variable under consideration, the sample size, and whether or not the population standard deviation is known.
(Essay)
4.9/5 (29)
A high school biology student wishes to test the hypothesis that hummingbird feeders can affect the mean mass of ruby-throated hummingbirds in the area surrounding the feeder. She captures
And weighs several of the hummingbirds near a science museum where several feeders are located. She obtains the following masses in grams: 4.2 3.9 3.6 3.5 3.9 3.8 3.8 4.1 3.9 3.8 3.2 3.4 The student's hypotheses are:
Use technology to calculate the P-value, then determine whether the data provide sufficient evidence to conclude that the mean mass of the birds in the area surrounding the feeder is greater than the mean mass of the general population. Test at the significance level and assume that the population standard deviation is . Also, assess the strength of the evidence against the null hypothesis.
(Multiple Choice)
4.8/5 (39)
In 1995, the mean math SAT score for students at one school was 488. A teacher introduces a new teaching method to prepare students for the SAT. One year later, he performs a hypothesis test to determine whether the mean math SAT score has increased. The hypotheses are
:\mu=488 :\mu>488
If the null hypothesis is rejected at the 10% level of significance, do you think the teacher would feel confident that his teaching method works? What about if the null hypothesis is rejected at the 1% level of significance? Which of these two results would constitute stronger evidence that his teaching method works? Explain your thinking.
(Essay)
4.7/5 (33)
A hypothesis test for a population mean is to be performed. The hypotheses are
:\mu=106 :\mu<106.
Which of the sketches below could represent the power curve for the test?
(Multiple Choice)
4.8/5 (29)
Provide an appropriate response.
-A pharmaceutical company has a new drug which relieves headaches. However, there is some indication that the drug may have the side effect of increasing blood pressure. Suppose the drug company conducts a hypothesis test to determine whether the medication raises blood pressure. The hypotheses are: : The drug does not increase blood pressure. : The drug increases blood pressure. Do you think that for doctors and patients it is more important to have a small α probability or a small β probability? Why? Do you think that the pharmaceutical company would prefer to have a small α probability or a small β probability? Why?
(Essay)
4.7/5 (28)
Perform a one-sample z-test for a population mean using the P-value approach. Be sure to state the hypotheses and thesignificance level, to compute the value of the test statistic, to obtain the P-value, and to state your conclusion. Also,assess the strength of the evidence against the null hypothesis.
-Last year, the mean running time for a certain type of flashlight battery was 8.5 hours. This year, the manufacturer has introduced a change in the production method which he hopes will increase the mean running time. A random sample of 40 of the new light bulbs was obtained and the mean running time was found to be 8.7 hours. Do the data provide sufficient evidence to conclude that the mean running time, µ, of the new light bulbs is larger than last year's mean of 8.5 hours? Perform the appropriate hypothesis test using a significance level of 5%. Assume that = 0.5 hours.
(Essay)
4.8/5 (34)
A hypothesis testing situation is given. The population standard deviation, sample size, and significance level are given.Complete the table to give the probability of a Type II error and the power for each of the given values of µ. Use the table to draw the power curve.
-A health insurer has determined that the "reasonable and customary" fee for a certain medical procedure is $1200. They suspect that the average fee charged by one particular clinic for this procedure is higher than $1200. The insurer wants to perform a hypothesis test to determine whether their suspicion is correct. Preliminary data analyses indicate that it is reasonable to apply a z-test. The hypotheses are :\mu=\ 1200 :\mu>\ 1200. Assume that , and the significance level is . Find the probability of a Type II error and the power for , , 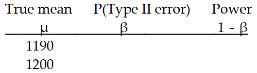 1190 1200 1210 1220 1230 1240 1250 1260 1270 1280 1290
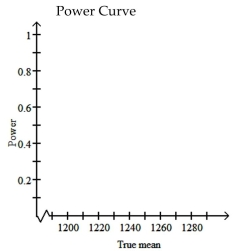
(Essay)
4.7/5 (27)
Construct a graph portraying the decision criterion for the specified hypothesis test.
-A hypothesis test for a population mean is conducted. The hypotheses are: :\mu= :\mu> The significance level is 0.04 and the critical value is 1.75. Sketch a normal curve displaying the decision criterion. This curve will represent the normal curve for the test statistic under the assumption that the null hypothesis is true. On your graph indicate the area in the tail, the critical value, the rejection region, and the nonrejection region.
(Essay)
4.9/5 (41)
Preliminary data analyses indicate that it is reasonable to use a t-test to carry out the specified hypothesis test. Performthe t-test using the critical-value approach.
-In one state, the mean time served in prison by convicted burglars is 18.7 months. A researcher would like to perform a hypothesis test to determine whether the mean amount of time served by convicted burglars in her hometown is different from 18.7 months. She takes a random sample of 11 such cases from court files in her home town and finds that = 21 months and s = 7 months. Use a 5% significance level to perform the test.
(Essay)
4.9/5 (35)
Decide whether it appears reasonable to use a t-test to perform a hypothesis test for the mean in question. Explain youranswer and include any relevant graphs, such as a normal probability plot, histogram, or stem-and-leaf diagram. If thereare outliers, explain how to proceed.
-Test scores for a random sample of 12 students were as follows: 22 30 34 37 40 45 49 53 58 65 74 87
(Essay)
4.8/5 (31)
What assumption is required for the Wilcoxon signed-rank test? Why do you think this assumption is required?
(Essay)
4.8/5 (29)
Perform a hypothesis test for the population mean. Assume that preliminary data analyses indicate that it is reasonable toapply the z-test. Use the critical-value approach.
-A researcher claims that the amounts of acetaminophen in a certain brand of cold tablets have a mean different from the 600 mg claimed by the manufacturer. Test this claim at the 2% level of significance. The mean acetaminophen content for a random sample of n = 48 tablets is 605 mg. Assume that the population standard deviation is 4.8 mg.
(Essay)
4.9/5 (29)
A one-sample z-test for a population mean is to be performed. Compare the steps involved in using the critical-value approach and the steps involved in using the P-value approach. Which steps do the two methods have in common? How do the two methods differ?
(Essay)
4.8/5 (38)
Provide an appropriate response.
-A man is on trial accused of murder in the first degree. The prosecutor presents evidence that he hopes will convince the jury to reject the hypothesis that the man is innocent. This situation can be modeled as a hypothesis test with the following hypotheses: : The defendant is innocent. : The defendant is guilty. If convicted, the defendant will receive the death penalty. Do you think that a Type I error or a Type II error would be more serious? Why?
(Essay)
4.8/5 (39)
Provide an appropriate response.
-Suppose that you wish to perform a hypothesis test for a population mean using the critical value method. The test is right-tailed. Suppose that the population standard deviation is unknown. The correct procedure to use is the t-test. If you mistakenly use the standard normal table to obtain the critical value, will the value that you obtain be larger or smaller than the correct value? Does the mistaken use of the normal table make it more or less likely that the null hypothesis will be rejected?
(Essay)
4.9/5 (32)
Construct a graph portraying the decision criterion for the specified hypothesis test.
-Suppose that you wish to perform a hypothesis test for a population mean. Suppose that the population standard deviation is unknown, the population is normally distributed, and the sample size is small. Would you perform a z-test or a t-test? Why? Would the test be exact or approximate?
(Essay)
4.8/5 (31)
A hypothesis test for a population mean is to be performed. The hypotheses are
:\mu=100 :\mu>100
Which of the sketches below could represent the power curve for the test?
(Multiple Choice)
4.8/5 (30)
Provide an appropriate response.
-Suppose that you want to perform a hypothesis test for a population mean. Give an example of a situation in which both the t-test and the Wilcoxon signed-rank test are permissible but the t-test is preferable. Specify the distribution of the variable under consideration, the sample size, and whether or not the population standard deviation is known.
(Essay)
4.9/5 (33)
Two graphical displays are given for a set of data. A hypothesis test is to be performed for the mean of the populationfrom which the data were obtained. Would it be reasonable to use a one-mean z-test? Explain your reasoning. Assumethat the population standard deviation is known.
-A normal probability plot and a stem-and-leaf diagram of the data are given below. 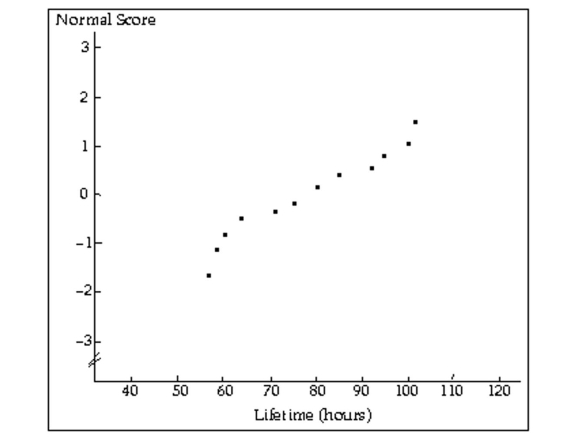 5 79 6 14 7 26 8 06 9 35 10 02
(Essay)
4.8/5 (26)
Filters
- Essay(0)
- Multiple Choice(0)
- Short Answer(0)
- True False(0)
- Matching(0)