Exam 16: Analysis of Variance Anova
Exam 1: The Nature of Statistics88 Questions
Exam 2: Organizing Data169 Questions
Exam 3: Descriptive Measures195 Questions
Exam 4: Probability Concepts133 Questions
Exam 5: Discrete Random Variables163 Questions
Exam 6: The Normal Distribution144 Questions
Exam 7: The Sampling Distribution of the Sample Mean76 Questions
Exam 8: Confidence Intervals for One Population Mean84 Questions
Exam 9: Hypothesis Tests for One Population Mean58 Questions
Exam 10: Inferences for Two Population Means103 Questions
Exam 11: Inferences for Population Standard Deviations101 Questions
Exam 12: Inferences for Population Proportions104 Questions
Exam 13: Chi-Square Procedures74 Questions
Exam 14: Descriptive Methods in Regression and Correlation55 Questions
Exam 15: Inferential Methods in Regression and Correlation41 Questions
Exam 16: Analysis of Variance Anova71 Questions
Select questions type
Perform a Kruskal-Wallis test using the critical-value approach.
-Four different types of fertilizers are used on raspberry plants. The number of raspberries on each randomly selected plant is given below. Use the Kruskal-Wallis test to test the claim that there is no difference in the distribution of the population Fertilizer 1 Fertilizer 2 Fertilizer 3 Fertilizer 4 10 9 10 7 9 12 7 9 10 9 8 7 11 9 7 8 11 9 6 9 10 10 7 8
(Essay)
4.9/5  (47)
(47)
Use Minitab to perform a Kruskal-Wallis test using the P-value approach.
-SAT scores for students selected randomly from three different schools are shown below. At the 0.05 significance level, do the data provide sufficient evidence to conclude that a difference exists between the three population means? 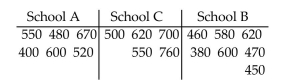
(Essay)
4.9/5 (35)
Find the required q-value.
-For a -curve with parameters and , find the -value having area to its right.
(Multiple Choice)
4.9/5 (42)
Preliminary data analyses indicate that it is reasonable to consider the assumptions for one-way ANOVA satisfied.Perform the required hypothesis test using the critical-value approach.
-At the 0.025 significance level, do the data provide sufficient evidence to conclude that a difference exists between the population means of the four different brands? The sample data are given below. 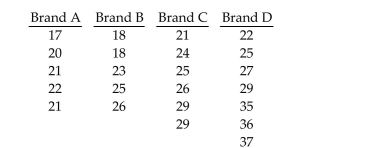
(Essay)
4.8/5 (32)
Do you think that the Kruskal-Wallis test is likely to be sensitive to extreme values/outliers? Why or why not?
(Essay)
4.7/5 (32)
Preliminary data analyses indicate that it is reasonable to consider the assumptions for one-way ANOVA satisfied. UseMinitab to perform the required hypothesis test using the p-value approach.
-At the 0.025 significance level, do the data provide sufficient evidence to conclude that a difference exists between the population means of the four different brands? The sample data are given below. 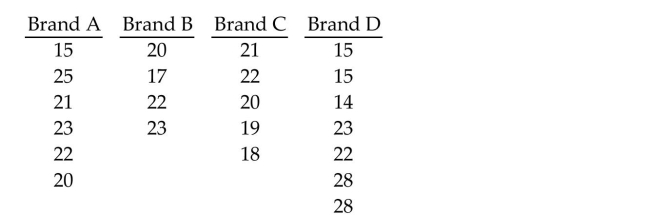
(Essay)
4.8/5 (35)
Find the required q-value.
-For a -curve with parameters and , find the -value having area to its right.
(Multiple Choice)
5.0/5 (33)
Use Minitab to perform a Kruskal-Wallis test using the P-value approach.
-Listed below are grade averages for randomly selected students with three different categories of high-school background. At the 0.05 significance level, do the data provide sufficient evidence to conclude that a difference exists in the three population means? 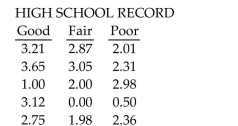
(Essay)
4.9/5 (42)
Conduct a Tukey multiple comparison. Display the confidence intervals in a table. State which population means can bedeclared different.
-Use a 95% family confidence level. Sample 1 Sample 2 Sample 3 Sample 4 Sample 5 6 5 9 2 12 7 10 4 3 9 5 6 5 3 9 8 8 2 4 5
(Essay)
4.9/5 (37)
Preliminary data analyses indicate that it is reasonable to consider the assumptions for one-way ANOVA satisfied.Perform the required hypothesis test using the critical-value approach.
-Random samples of four different models of cars were selected and the gas mileage of each car was measured. The results are shown below. 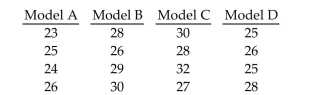 Test the claim that the four different models have the same population mean. Use a significance level of 0.05.
(Essay)
4.7/5 (56)
Conduct a Tukey multiple comparison. Display the confidence intervals in a table. State which population means can bedeclared different.
-Perform a Tukey multiple comparison to compare the breaking strengths of four different kinds of thread. Use a 95% family confidence level. Independent random samples of the four different kinds of thread yielded the following breaking strengths in ounces. Thread A Thread B Thread C Thread D 14 18 21 19 16 19 22 17 16 19 21 18 15 20 23 19 15 23
(Essay)
4.7/5 (29)
A one-way ANOVA is performed to compare the means of three populations. The sample sizes are 10, 11, and 13. Determine the degrees of freedom for the F-statistic.
(Multiple Choice)
4.9/5 (49)
Preliminary data analyses indicate that it is reasonable to consider the assumptions for one-way ANOVA satisfied.Perform the required hypothesis test using the critical-value approach.
-A realtor wishes to compare the square footage of houses in 4 different cities, all of which are priced approximately the same. The data are listed below. Can the realtor conclude that the mean square footage in the four cities are equa City \#1 City \#2 City \#3 City \#4 2150 1780 1530 2400 2210 1540 1750 2350 1980 1690 1580 2600 2000 1650 1670 2200 1900 1500 2000 1600 2150 2350
(Essay)
4.7/5 (41)
Perform a Kruskal-Wallis test using the critical-value approach.
-Listed below are grade averages for randomly selected students with three different categories of high-school background. At the 0.05 significance level, do the data provide sufficient evidence to conclude that a difference exists in the three population means? 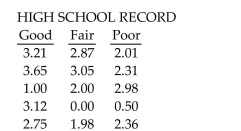
(Essay)
4.8/5 (41)
Preliminary data analyses indicate that it is reasonable to consider the assumptions for one-way ANOVA satisfied. UseMinitab to perform the required hypothesis test using the p-value approach.
-A consumer magazine wants to compare the lifetimes of ballpoint pens of three different types. The magazine takes a random sample of pens of each type in the following table. 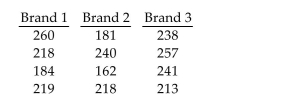 Do the data indicate that there is a difference in mean lifetime for the three brands of ballpoint pens? Us
(Essay)
4.8/5 (24)
Perform a Kruskal-Wallis test using the critical-value approach.
-A medical researcher wishes to try three different techniques to lower blood pressure of patients with high blood pressure. The subjects are randomly selected and assigned to one of three groups. Group 1 is given medication, Group 2 is given an exercise program, and Group 3 is assigned a diet program. At the end of six weeks, the reduction in each subject's blood pressure is recorded. Use the Kruskal-Wallis test to test the claim that there is no difference in the distribution of the populations. Us Group 1 Group 2 Group 3 16 13 11 17 10 17 14 7 9 20 8 13 18 9 14 13 5 9
(Essay)
4.7/5 (44)
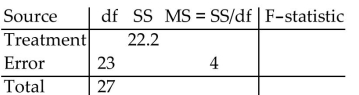
Fill in the missing entries in the partially completed one-way ANOVA table.
-
(Multiple Choice)
5.0/5 (27)
Explain the rationale behind the Kruskal-Wallis test. Explain, in particular, why a large value of the test statistic suggests that the population means are not equal.
(Essay)
4.9/5 (37)
Filters
- Essay(0)
- Multiple Choice(0)
- Short Answer(0)
- True False(0)
- Matching(0)