Exam 16: Analysis of Variance Anova
Exam 1: The Nature of Statistics88 Questions
Exam 2: Organizing Data169 Questions
Exam 3: Descriptive Measures195 Questions
Exam 4: Probability Concepts133 Questions
Exam 5: Discrete Random Variables163 Questions
Exam 6: The Normal Distribution144 Questions
Exam 7: The Sampling Distribution of the Sample Mean76 Questions
Exam 8: Confidence Intervals for One Population Mean84 Questions
Exam 9: Hypothesis Tests for One Population Mean58 Questions
Exam 10: Inferences for Two Population Means103 Questions
Exam 11: Inferences for Population Standard Deviations101 Questions
Exam 12: Inferences for Population Proportions104 Questions
Exam 13: Chi-Square Procedures74 Questions
Exam 14: Descriptive Methods in Regression and Correlation55 Questions
Exam 15: Inferential Methods in Regression and Correlation41 Questions
Exam 16: Analysis of Variance Anova71 Questions
Select questions type
Perform a Kruskal-Wallis test using the critical-value approach.
-SAT scores for students selected randomly from three different schools are shown below. At the 0.05 significance level, do the data provide sufficient evidence to conclude that a difference exists between the three population means? 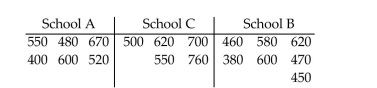
(Essay)
4.9/5  (44)
(44)
Construct a normal probability plot of the given data.
-The time (in minutes)it takes to assemble a computer component for 3 different machines is listed below. Workers are randomly selected. Use the Kruskal-Wallis test to test the claim that there is no difference in the distribution of the population Machine 1 Machine 2 Machine 3 32 40 28 31 29 25 32 38 29 30 33 31 33 35 30 31 32 27 32 36 37
(Essay)
4.9/5 (36)
Preliminary data analyses indicate that it is reasonable to consider the assumptions for one-way ANOVA satisfied.Perform the required hypothesis test using the critical-value approach.
-A consumer magazine wants to compare the lifetimes of ballpoint pens of three different types. The magazine takes a random sample of pens of each type in the following table. 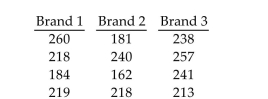 Do the data indicate that there is a difference in mean lifetime for the three brands of ballpoint pens? Us
(Essay)
4.9/5 (28)
A one-way ANOVA is to be performed. Independent random samples are taken from two populations. The sample data are depicted in the dotplot below. Is it reasonable to conclude that the difference between the sample means is due to a difference between the population means and not to variation within the populations? Do you think the null hypothesis would be rejected? Explain your thinking.  Sample from population 1
 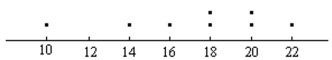 Sample from population 2
(Essay)
4.9/5 (30)
Find the required q-value.
-For a -curve with parameters and , find
(Multiple Choice)
4.9/5 (36)
In the context of a one-way ANOVA, explain what is meant by variation between samples and variation within samples.
(Essay)
4.9/5 (44)
A one-way ANOVA is to be performed. The following sample data are obtained. The common population standard deviation for the three populations is 2.5. Do you think that the difference between the sample means could be due to variation within the populations or does it seem clear that the difference between the sample means is due to a difference between population means? Do you think that the null hypothesis would be rejected? Explain your thinking.
(Essay)
4.8/5 (37)
Preliminary data analyses indicate that it is reasonable to consider the assumptions for one-way ANOVA satisfied. UseMinitab to perform the required hypothesis test using the p-value approach.
-At the 0.025 significance level, do the data provide sufficient evidence to conclude that a difference exists between the population means of the four different brands? The sample data are given below. 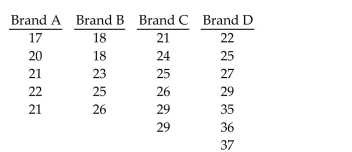
(Essay)
4.8/5 (43)
Compute the value of the H test statistic.
-A Kruskall-Wallis test is to be performed to compare three population means. Independent random samples are selected from three different populations. The sample data are given in the
Table below. 20.3 33.8 35.0 25 21.8 28.8 17.1 18.3 31.6 17.6 16.8 25.7 19.7 27.4 18.8 18.3 32.9 33.8
(Multiple Choice)
4.8/5 (38)
Preliminary data analyses indicate that it is reasonable to consider the assumptions for one-way ANOVA satisfied. UseMinitab to perform the required hypothesis test using the p-value approach.
-The data below represent the weight losses for people on three different exercise programs. 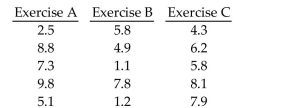 At the 1% significance level, does it appear that a difference exists in the true mean weight loss produced by the three exercise programs?
(Essay)
4.9/5 (34)
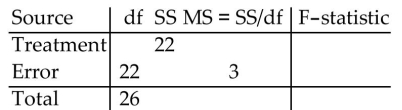
Fill in the missing entries in the partially completed one-way ANOVA table.
-
(Multiple Choice)
4.8/5 (32)
Use Minitab to perform a Kruskal-Wallis test using the P-value approach.
-A fire-science specialist tests three different brands of flares for their burning times (in minutes)and the results are given below for the sample data. At the 0.05 significance level, do the data provide sufficient evidence to conclude that a difference exists between the mean burn times of the three different brands? Use the Kruskal-Wallis test. Brand X 16.4 17.6 18.3 17.0 17.1 17.3 Brand Y 17.9 18.0 17.8 18.4 17.6 19.0 19.1 Brand Z 17.3 16.4 16.5 16.0 15.8 16.3 17.1
(Essay)
4.9/5 (38)
Preliminary data analyses indicate that it is reasonable to consider the assumptions for one-way ANOVA satisfied. UseMinitab to perform the required hypothesis test using the p-value approach.
-At the 0.01 significance level, do the data provide sufficient evidence to conclude that a difference exists between the population means of the three different brands ? The sample data are given below. 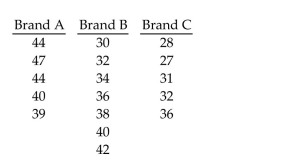
(Essay)
4.9/5 (34)
A one-way ANOVA is being performed. Suppose that SST = 120 and SSE = 70.3. Find the value of the third sum of squares, give its notation, state its name and the source of variation it represents.
(Essay)
4.9/5 (42)
Compute the sum of squares.
-A one-way ANOVA is to be performed. Independent random samples are selected from four different populations. The sample data are given in the table below.
Sample 1 Sample 2 Sample 3 Sample 4 3 5 3 4 2 6 5 7 1 1 9 8 7 7
Compute the error sum of squares, SSE.
(Multiple Choice)
4.7/5 (32)
A one-way ANOVA is performed to compare the means of four populations. If the null hypothesis is not rejected, would it make sense to then perform a Tukey multiple comparison? If the null hypothesis is rejected, would it make sense to then perform a Tukey multiple comparison? Explain your reasoning. What can be determined from a Tukey multiple comparison that cannot be determined from a one-way ANOVA?
(Essay)
4.7/5 (36)
Preliminary data analyses indicate that it is reasonable to consider the assumptions for one-way ANOVA satisfied.Perform the required hypothesis test using the critical-value approach.
-A medical researcher wishes to try three different techniques to lower blood pressure of patients with high blood pressure. The subjects are randomly selected and assigned to one of three groups. Group 1 is given medication, Group 2 is given an exercise program, and Group 3 is assigned a diet program. At the end of six weeks, each subject's blood pressure is recorded. Test the claim that there is no difference among the means. 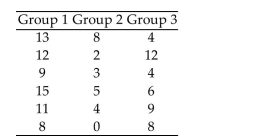
(Essay)
4.8/5 (37)
Perform a Kruskal-Wallis test using the critical-value approach.
-A realtor wishes to compare the square footage of houses in 4 different cities, all of which are priced approximately the same. The data are listed below. Use the Kruskal-Wallis test to test the claim that there is no difference in the distribution of the populations 0.05. City 1 City 2 City 3 City 4 2180 1810 1560 2430 2010 1570 1700 2380 2030 1720 1610 2630 2240 1680 1630 2180 1930 1730 1530 2030 2080 1780 2230 1680 2380 2280
(Essay)
4.8/5 (34)
When performing a Tukey multiple comparison, the population means are compared pairwise. How do you decide whether to declare two population means different? Why does this make sense?
(Essay)
4.8/5 (42)
Preliminary data analyses indicate that it is reasonable to consider the assumptions for one-way ANOVA satisfied. UseMinitab to perform the required hypothesis test using the p-value approach.
-At the 0.025 significance level, do the data provide sufficient evidence to conclude that a difference exists between the population means of the three different brands? The sample data are given below. 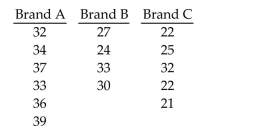
(Essay)
4.9/5 (41)
Filters
- Essay(0)
- Multiple Choice(0)
- Short Answer(0)
- True False(0)
- Matching(0)