Exam 11: Simple Linear Regression
Exam 1: Statistics, Data, and Statistical Thinking77 Questions
Exam 2: Methods for Describing Sets of Data187 Questions
Exam 3: Probability284 Questions
Exam 4: Discrete Random Variables134 Questions
Exam 5: Continuous Random Variables138 Questions
Exam 6: Sampling Distributions52 Questions
Exam 7: Inferences Based on a Single Sample: Estimation With Confidence Intervals125 Questions
Exam 8: Inferences Based on a Single144 Questions
Exam 9: Inferences Based on Two Samples: Confidence Intervals and Tests of Hypotheses100 Questions
Exam 10: Analysis of Variance: Comparing More Than Two Means91 Questions
Exam 11: Simple Linear Regression113 Questions
Exam 12: Multiple Regression and Model Building131 Questions
Exam 13: Categorical Data Analysis60 Questions
Exam 14: Nonparametric Statistics Available Online87 Questions
Select questions type
Consider the following pairs of measurements: x 1 3 4 6 7 y 3 6 8 12 13
a. Construct a scattergram for the data.
b. What does the scattergram suggest about the relationship between and ?
c. Find the least squares estimates of and .
d. Plot the least squares line on your scattergram. Does the line appear to fit the data well?
(Essay)
4.9/5  (29)
(29)
What is the relationship between diamond price and carat size? 307 diamonds were sampled (ranging in size from 0.18 to 1.1 carats)and a straight-line relationship was hypothesized between
Y = diamond price (in dollars)and x = size of the diamond (in carats). The simple linear regression
For the analysis is shown below: Least Squares Linear Regression of PRICE
Predictor
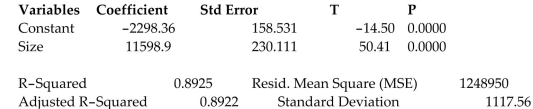 Interpret the estimated -intercept of the regression line.
(Multiple Choice)
4.8/5 (34)
Is there a relationship between the raises administrators at State University receive and their performance on the job? A faculty group wants to determine whether job rating is a useful linear predictor of raise . Consequently, the group considered the straight-line regression model
Using the method of least squares, the faculty group obtained the following prediction equation:
Interpret the estimated slope of the line.
(Multiple Choice)
4.8/5 (48)
A county real estate appraiser wants to develop a statistical model to predict the appraised value of houses in a section of the county called East Meadow. One of the many variables thought to be
An important predictor of appraised value is the number of rooms in the house. Consequently, the
Appraiser decided to fit the simple linear regression model:
where appraised value of the house (in thousands of dollars) and number of rooms. Using data collected for a sample of houses in East Meadow, the following results were obtained:
Give a practical interpretation of the estimate of , the standard deviation of the random error term in the model.
(Multiple Choice)
4.9/5 (38)
For the situation above, give a practical interpretation of .
(Multiple Choice)
4.9/5 (43)
If a least squares line were determined for the data set in each scattergram, which would have the smallest variance?
(Multiple Choice)
5.0/5 (40)
The coefficient of correlation is a useful measure of the linear relationship between two variables.
(True/False)
4.9/5 (39)
Consider the data set shown below. Find the 95% confidence interval for the slope of the regression line. 0 3 2 3 8 10 11 -2 0 2 4 6 8 10
(Multiple Choice)
4.8/5 (41)
In team-teaching, two or more teachers lead a class. An researcher tested the use of
team-teaching in mathematics education. Two of the variables measured on each sample
of 165 mathematics teachers were years of teaching experience x and reported success rate
y (measured as a percentage)of team-teaching mathematics classes.
a. The researcher hypothesized that mathematics teachers with more years of experience
will report higher perceived success rates in team-taught classes.
State this hypothesis in terms of the parameter of a linear model relating x to y.
b. The correlation coefficient for the sample data was reported as r = -0.31.
Interpret this result.
c. Does the value of r support the hypothesis? Test using α = .05.
(Essay)
4.9/5 (32)
A county real estate appraiser wants to develop a statistical model to predict the appraised value of houses in a section of the county called East Meadow. One of the many variables thought to be
An important predictor of appraised value is the number of rooms in the house. Consequently, the
Appraiser decided to fit the simple linear regression model:
where appraised value of the house (in thousands of dollars) and number of rooms. Using data collected for a sample of houses in East Meadow, the following results were obtained:
Give a practical interpretation of the estimate of the -intercept of the least squares line.
(Multiple Choice)
4.9/5 (39)
A low value of the correlation coefficient r implies that x and y are unrelated.
(True/False)
4.8/5 (40)
Consider the data set shown below. Find the estimate of the slope of the least squares regression line. 0 3 2 3 8 10 11 -2 0 2 4 6 8 10
(Multiple Choice)
5.0/5 (35)
For the situation above, give a practical interpretation of .
(Multiple Choice)
4.8/5 (44)
For the situation above, write the equation of the least squares line.
(Multiple Choice)
4.8/5 (41)
Locate the values of , and on the printout below.
Model R R Square Adjusted R Square Std. Error of the Estimate 1 .859 .737 .689 11.826
ANOVA
Model Sum of Squares df Mean Square F Sig. 1 Regression 4512.024 1 4512.024 32.265 .001 Residual 1678.115 12 139.843 Total 6190.139 13
(Multiple Choice)
4.9/5 (46)
For the situation above, give a practical interpretation of .
(Multiple Choice)
4.9/5 (37)
Suppose you fit a least squares line to 22 data points and the calculated value of SSE is
.678. a. Find , the estimator of .
b. Find , the estimator of .
c. What is the largest deviation you might expect between any one of the 22 points and the least squares line?
(Essay)
4.7/5 (36)
Is the number of games won by a major league baseball team in a season related to the
teamʹs batting average? Data from 14 teams were collected and the summary statistics
yield: Find the least squares prediction equation for predicting the number of games won, y,
using a straight-line relationship with the teamʹs batting average, x.
(Essay)
4.8/5 (32)
Filters
- Essay(0)
- Multiple Choice(0)
- Short Answer(0)
- True False(0)
- Matching(0)