Exam 11: Simple Linear Regression
Exam 1: Statistics, Data, and Statistical Thinking77 Questions
Exam 2: Methods for Describing Sets of Data187 Questions
Exam 3: Probability284 Questions
Exam 4: Discrete Random Variables134 Questions
Exam 5: Continuous Random Variables138 Questions
Exam 6: Sampling Distributions52 Questions
Exam 7: Inferences Based on a Single Sample: Estimation With Confidence Intervals125 Questions
Exam 8: Inferences Based on a Single144 Questions
Exam 9: Inferences Based on Two Samples: Confidence Intervals and Tests of Hypotheses100 Questions
Exam 10: Analysis of Variance: Comparing More Than Two Means91 Questions
Exam 11: Simple Linear Regression113 Questions
Exam 12: Multiple Regression and Model Building131 Questions
Exam 13: Categorical Data Analysis60 Questions
Exam 14: Nonparametric Statistics Available Online87 Questions
Select questions type
In a study of feeding behavior, zoologists recorded the number of grunts of a warthog
feeding by a lake in the 15 minute period following the addition of food. The data showing
the number of grunts and the age of the warthog (in days)are listed below: Number of Grunts Age (days) 104 132 82 148 53 162 58 167 77 174 54 181 76 190 31 196 36 202
a. Find , and .
b. Interpret the value of .
(Essay)
4.7/5  (36)
(36)
What is the relationship between diamond price and carat size? 307 diamonds were sampled and a straight-line relationship was hypothesized between y = diamond price (in dollars)and x = size of
The diamond (in carats). The simple linear regression for the analysis is shown below: Least Squares Linear Regression of PRICE
Predictor
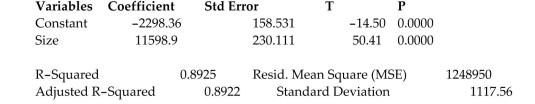 Which of the following conclusions is correct when testing to determine if the size of the diamond is a useful positive linear predictor of the price of a diamond?
(Multiple Choice)
4.9/5 (23)
Operations managers often use work sampling to estimate how much time workers spend
on each operation. Work sampling-which involves observing workers at random points
in time-was applied to the staff of the catalog sales department of a clothing
manufacturer. The department applied regression to data collected for 40 randomly
selected working days. The simple linear model was fit to the data. The printouts for the analysis are given below:
TIME: Time spent (in hours) taking telephone orders during the day
ORDERS: Number of telephone orders received during the day
UNWEIGHTED LEAST SQUARES LINEAR REGRESSION OF TIME
PREDICTOR PREDICTOR VARIABLES COEFFICIENT STD ERROR STUDENT'ST CONSTANT 10.1639 1.77844 5.72 0.0000 ORDERS 0.05836 0.00586 9.96 0.0000
R-SQUARED 0.7229 RESID. MEAN SQUARE (MSE) 11.6175 ADJUSTED R-SQUARED 0.7156 STANDARD DEVIATION 3.40844
SOURCE DF SS MS REGRESSION 1 1151.55 1151.55 99.12 0.0000 RESIDUAL 38 441.464 11.6175 TOTAL 39 1593.01
CASES INCLUDED 40 MISSING CASES 0
Conduct a test of hypothesis to determine if time spent (in hours) taking telephone orders during the day and the number of telephone orders received during the day are positively linearly related. Use .
(Essay)
4.7/5 (29)
Set up the null and alternative hypotheses for testing whether a positive linear relationship exists between SALARY and GMAT in the situation above.
(Multiple Choice)
4.8/5 (40)
Is there a relationship between the raises administrators at State University receive and their performance on the job? A faculty group wants to determine whether job rating is a useful linear predictor of raise ( ). Consequently, the group considered the straight-line regression model
Using the method of least squares, the faculty group obtained the following prediction equation:
Interpret the estimated -intercept of the line.
(Multiple Choice)
4.9/5 (40)
A study of the top 75 MBA programs attempted to predict the average starting salary (in $1000's) of graduates of the program based on the amount of tuition (in $1000's)charged by the program.
The results of a simple linear regression analysis are shown below: Least Squares Linear Regression of Salary
Predictor
Variables Coefficient Std Error T P Constant 18.1849 10.3336 1.76 0.0826 Size 1.47494 0.14017 10.52 0.0000
 The model was then used to create confidence and prediction intervals for and for when the tuition charged by the MBA program was . The results are shown here:
95\% confidence interval for :
prediction interval for :
Which of the following interpretations is correct if you want to use the model to predict for a single MBA programs?
The model was then used to create confidence and prediction intervals for and for when the tuition charged by the MBA program was . The results are shown here:
95\% confidence interval for :
prediction interval for :
Which of the following interpretations is correct if you want to use the model to predict for a single MBA programs?
(Multiple Choice)
4.8/5 (35)
In a comprehensive road test on new car models, one variable measured is the time it takes a car to accelerate from 0 to 60 miles per hour. To model acceleration time, a regression analysis is
Conducted on a random sample of 129 new cars. TIME60: Elapsed time (in seconds) from to
MAX: Maximum speed attained (miles per hour)
The simple linear model was fit to the data. Computer printouts for the analysis are given below:
NWEIGHTED LEAST SQUARES LINEAR REGRESSION OF TIME60
PREDICTOR VARIABLES COEFFICIENT STD ERROR STUDENTS T P CONSTANT 18.7171 0.63708 29.38 0.0000 MAX -0.08365 0.00491 -17.05 0.0000
R-SQUARED 0.6960 RESID. MEAN SQUARE (MSE) 1.28695 ADJUSTED R-SQUARED 0.6937 STANDARD DEVIATION 1.13444
SOURCE DF SS MS F P REGRESSION 1 374.285 374.285 290.83 0.0000 RESIDUAL 127 163.443 1.28695 TOTAL 128 537.728
CASES INCLUDED 129 MISSING CASES 0
Fill in the blank: "At , there is ________between maximum speed and acceleration time."
(Multiple Choice)
4.8/5 (41)
A manufacturer of boiler drums wants to use regression to predict the number of man-hours needed to erect drums in the future. The manufacturer collected a random sample of 35 boilers
And measured the following two variables: MANHRS: Number of man-hours required to erect the drum
PRESSURE: Boiler design pressure (pounds per square inch, i.e., psi)
The simple linear model was fit to the data. A printout for the analysis appears below:
UNWEIGHTED LEAST SQUARES LINEAR REGRESSION OF MANHRS
PREDICTOR VARIABLES COEFFICIENT STD ERROR STUDENT'S T P CONSTANT 1.88059 0.58380 3.22 0.0028 PRESSURE 0.00321 0.00163 2.17 0.0300
R-SQUARED 0.4342 RESID. MEAN SQUARE (MSE) 4.25460 ADJUSTED R-SQUARED 0.4176 STANDARD DEVIATION 2.06267
SOURCE DF SS MS F P REGRESSION 1 111.008 111.008 5.19 0.0300 RESIDUAL 34 144.656 4.25160 TOTAL 35 255.665
Fill in the blank. At , there is ________between man-hours and pressure.
(Multiple Choice)
4.7/5 (39)
A county real estate appraiser wants to develop a statistical model to predict the appraised value of houses in a section of the county called East Meadow. One of the many variables thought to be
An important predictor of appraised value is the number of rooms in the house. Consequently, the
Appraiser decided to fit the linear regression model:
where appraised value of the house (in thousands of dollars) and number of rooms. Using data collected for a sample of houses in East Meadow, the following result was obtained:
Which of the following statements concerning the deterministic model, is true?
(Multiple Choice)
4.9/5 (28)
A large national bank charges local companies for using their services. A bank official reported the results of a regression analysis designed to predict the bankʹs charges (y), measured in dollars per
Month, for services rendered to local companies. One independent variable used to predict service
Charge to a company is the companyʹs sales revenue (x), measured in $ million. Data for 21
Companies who use the bankʹs services were used to fit the model
The results of the simple linear regression are provided below.
Interpret the -value for testing whether exceeds 0 .
(Multiple Choice)
4.8/5 (36)
What is the relationship between diamond price and carat size? 307 diamonds were sampled and a straight-line relationship was hypothesized between y = diamond price (in dollars)and x = size of
The diamond (in carats). The simple linear regression for the analysis is shown below: Least Squares Linear Regression of PRICE
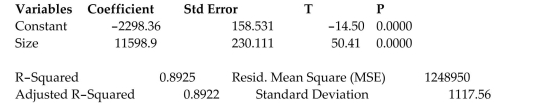 The model was then used to create confidence and prediction intervals for and for when the carat size of the diamond was 1 carat. The results are shown here:
confidence interval for :
prediction interval for
Which of the following interpretations is correct if you want to use the model to determine the price of a single 1 -carat diamond?
The model was then used to create confidence and prediction intervals for and for when the carat size of the diamond was 1 carat. The results are shown here:
confidence interval for :
prediction interval for
Which of the following interpretations is correct if you want to use the model to determine the price of a single 1 -carat diamond?
(Multiple Choice)
4.7/5 (45)
A large national bank charges local companies for using their services. A bank official reported the results of a regression analysis designed to predict the bankʹs charges (y), measured in dollars per
Month, for services rendered to local companies. One independent variable used to predict service
Charge to a company is the companyʹs sales revenue (x), measured in $ million. Data for 21
Companies who use the bankʹs services were used to fit the model
Suppose a confidence interval for is . Interpret the interval.
(Multiple Choice)
4.8/5 (38)
Filters
- Essay(0)
- Multiple Choice(0)
- Short Answer(0)
- True False(0)
- Matching(0)