Exam 10: Analysis of Variance: Comparing More Than Two Means
Exam 1: Statistics, Data, and Statistical Thinking77 Questions
Exam 2: Methods for Describing Sets of Data187 Questions
Exam 3: Probability284 Questions
Exam 4: Discrete Random Variables134 Questions
Exam 5: Continuous Random Variables138 Questions
Exam 6: Sampling Distributions52 Questions
Exam 7: Inferences Based on a Single Sample: Estimation With Confidence Intervals125 Questions
Exam 8: Inferences Based on a Single144 Questions
Exam 9: Inferences Based on Two Samples: Confidence Intervals and Tests of Hypotheses100 Questions
Exam 10: Analysis of Variance: Comparing More Than Two Means91 Questions
Exam 11: Simple Linear Regression113 Questions
Exam 12: Multiple Regression and Model Building131 Questions
Exam 13: Categorical Data Analysis60 Questions
Exam 14: Nonparametric Statistics Available Online87 Questions
Select questions type
A local consumer reporter wants to compare the average costs of grocery items purchased
at three different supermarkets, A, B, and C. Prices (in dollars)were recorded for a sample
of 60 randomly selected grocery items at each of the three supermarkets. In order to
reduce item-to-item variation, the prices were recorded for each item on the same day at
each supermarket.
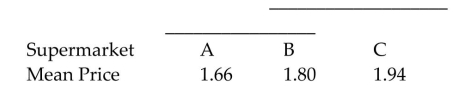 Fully interpret the Bonferroni analysis.
(Essay)
4.9/5  (42)
(42)
When a variable is identified as reducing variation in the response variable, but no additional
knowledge concerning the variable is desired, it should be used as the blocking factor in the
randomized block design.
(True/False)
4.8/5 (36)
The goal of an experiment is to investigate the factors that affect visitor travel time in a complex, multilevel building on campus. Specifically, we want to determine whether the effect of directional
Aid (wall signs or map)on travel time depends on starting room location (interior or exterior).
Three visitors were assigned to each of the combinations of directional aid and starting room
Location, and the travel times of each (in seconds)to reach the goal destination room were
Recorded. DIRECTIONAL AID STARTING Interior ROOM Exterior Wall signs 149 222 125 335 211 139 Map 153 226 130 329 223 141
Explain how to properly analyze these data.
(Multiple Choice)
4.8/5 (39)
Which method generally produces wider confidence intervals?
(Multiple Choice)
4.9/5 (43)
A multiple-comparison procedure for comparing four treatment means produced the confidence intervals shown below. Rank the means from smallest to largest. Use solid lines to connect those
Means which are not significantly different. - :(7,21) - :(-6,2) - :(10,20) - :(-19,-13) - :(-3,5) - :(10,24)
(Multiple Choice)
4.9/5 (35)
A certain HMO is attempting to show the benefits of managed health care to an insurance company. The HMO believes that certain types of doctors are more cost-effective than others. One
Theory is that primary specialty is an important factor in measuring the cost-effectiveness of
Physicians. To investigate this, the HMO obtained independent random samples of 25 HMO
Physicians from each of four primary specialties-- General Practice (GP), Internal Medicine (IM),
Pediatrics (PED), and Family Physician (FP)-- and recorded the total per-member, per-month
Charges for each. Identify the treatments for this group.
(Multiple Choice)
4.8/5 (33)
Psychologists have found that people are generally reluctant to transmit bad news to their
peers. This phenomenon has been named the ʺMUM effect.ʺ To investigate the cause of the
MUM effect, 40 undergraduates at a university participated in an experiment. Each subject
was asked to administer an IQ test to another student and then provide the test taker with
his or her percentile score. (Unknown to the subject, the test taker was a bogus student
who was working with the researchers.)The experimenters manipulated two factors,
subject visibility and success of test taker, each at two levels. Subject visibility was either
visible or not visible to the test taker. Success of test taker was either top 20% or bottom
20%. Ten subjects were randomly assigned to each of the 2 x 2 = 4 experimental
conditions, then the time (in seconds)between the end of the test and the delivery of the
percentile score from the subject to the test taker was measured. (This variable is called the
latency to feedback.)The data was subject to an analysis of variance, with the following
results: Source df SS MS F PR > F Subject visibility 1 1380.24 1380.24 4.25 0.430 Test taker success 1 1325.16 1325.16 -1371.89 0.05 Visibility x success 1 3385.80 3385.80 10.45 .002 Error 36 11,664.00 324.00 Total 39 17,755.20
Is there evidence to indicate that subject visibility and test taker success interact?
Use .
(Essay)
4.8/5 (27)
Psychologists have found that people are generally reluctant to transmit bad news to their
peers. This phenomenon has been named the ʺMUM effect.ʺ To investigate the cause of the
MUM effect, undergraduates at a university participated in an experiment. Each subject
was asked to administer an IQ test to another student and then provide the test taker with
his or her percentile score. (Unknown to the subject, the test taker was a bogus student
who was working with the researchers.)The experimenters manipulated two factors,
subject visibility and success of test taker, each at two levels. Subject visibility was either
visible or not visible to the test taker. Success of test taker was either top 20% or bottom
20%. Fifteen subjects were randomly assigned to each of the 2 x 2 = 4 experimental
conditions. Then the time (in seconds)between the end of the test and the delivery of the
percentile score from the subject to the test taker was measured. (This variable is called the
latency to feedback.)Describe the experiment, including the response variable, factors,
factor levels, replications, and treatments.
(Essay)
4.8/5 (39)
307 diamonds were sampled and randomly sorted into three groups of diamonds. These diamonds were randomly assigned to one of the three organizations, or groups (HRD, GIA, or IGI), that
Certify the appraisal of diamonds. A study was conducted to determine if the average size of
Diamonds reported by these three certification groups differ. A completely randomized design was
Used and the Bonferroni multiple comparison results are shown below. Bonferroni All-Pairwise Comparisons Test of CARAT by CERT
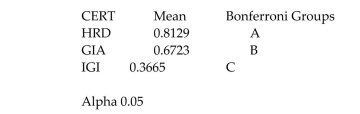 Give the population mean(s) which are in the statistically largest group.
(Multiple Choice)
4.9/5 (38)
Which procedure was specifically developed for pairwise comparisons when the sample sizes of the treatments are equal?
(Multiple Choice)
4.9/5 (29)
Suppose a company makes 4 different frozen dinners, and tests their ability to attract customers. They test the frozen dinners in 13 different stores in order to account for any extraneous sources of
Variation. The company records the number of customers who purchase each product at each
Store. What assumptions are necessary for the validity of the F statistic for comparing the response
Means of the 4 frozen dinners?
(Multiple Choice)
4.9/5 (37)
The variables, quantitative or qualitative, whose effect on a response variable is of interest are called __________.
(Multiple Choice)
4.8/5 (42)
A certain HMO is attempting to show the benefits of managed care to an insurance company. The HMO believes that certain types of doctors are more cost-effective than others. One theory is that
Certification level is an important factor in measuring the cost-effectiveness of physicians. To
Investigate this, the HMO obtained independent random samples of 22 physicians from each of the
Three certification levels- Board certified (C); Uncertified, board eligible (E); and Uncertified,
Board ineligible (I)- and recorded the total per-member, per-month charges for each (a total of 66
Physicians). Identify the dependent (response)variable for this study.
(Multiple Choice)
4.8/5 (38)
A market research firm is interested in the possible success of new flavors of ice cream. A
study was conducted with three different flavors-peach, almond, and coconut. Three
participants were given a sample of each ice cream, in random order, and asked to rate the
flavors on a 100-point scale. The results are given in the table below. FLAVOR PARTICIPANT Peach Almond Coconut 1 74 82 72 2 79 97 77 3 82 88 73
a. What is the purpose of blocking on participants in this study?
b. Construct an ANOVA summary table using the information given.
c. Is there sufficient evidence of a difference in the mean ratings for the three flavors? Use .
(Essay)
4.9/5 (34)
A certain HMO is attempting to show the benefits of managed health care to an insurance company. The HMO believes that certain types of doctors are more cost-effective than others. One
Theory is that both primary specialty and whether the physician is a foreign or USA medical school
Graduate are an important factors in measuring the cost-effectiveness of physicians. To investigate
This, the president obtained independent random samples of 40 HMO physicians, half foreign
Graduates and half USA graduates, from each of four primary specialties-General Practice (GP),
Internal Medicine (IM), Pediatrics (PED), and Family Physician (FP)-and recorded the total
Per-member, per-month charges for each. Thus, information on charges were obtained for a total
Of n = 160 doctors. The ANOVA results are summarized in the following table. Source df SS MS F Value Prob > F Specialty 3 22855 7618 60.94 .0001 Medschool 1 105 105 0.84 .6744 Interaction 3 890 297 2.38 .1348 Error 152 18950 125 Total 159 42800
Assuming no interaction, is there evidence of a difference between the mean charges of USA and foreign medical school graduates? Use .
(Multiple Choice)
5.0/5 (31)
A certain HMO is attempting to show the benefits of managed care to an insurance company. The HMO believes that certain types of doctors are more cost-effective than others. One theory is that
Certification level is an important factor in measuring the cost-effectiveness of physicians. To
Investigate this, the HMO obtained independent random samples of 27 physicians from each of the
Three certification levels-Board certified (C); Uncertified, board eligible (E); and Uncertified, board
Ineligible (I)- and recorded the total per member per month charges for each (a total of 81
Physicians). How many factors are present in this study?
(Multiple Choice)
4.9/5 (29)
307 diamonds were sampled and randomly sorted into three groups of diamonds. These diamonds were randomly assigned to one of the three organizations, or groups (HRD, GIA, or IGI), that
Certify the appraisal of diamonds. A study was conducted to determine if the average size of
Diamonds reported by these three certification groups differ. A completely randomized design was
Used and the resulting ANOVA table is shown below. One-Way AOV for CARAT by CERT Source DF SS MS F CERT 2 8.3265 4.16326 ??? Error 305 15.2604 0.05003 Total 307 23.5869
Find the F-value that is missing in the ANOVA table.
(Multiple Choice)
5.0/5 (41)
Filters
- Essay(0)
- Multiple Choice(0)
- Short Answer(0)
- True False(0)
- Matching(0)