Exam 10: Analysis of Variance: Comparing More Than Two Means
Exam 1: Statistics, Data, and Statistical Thinking77 Questions
Exam 2: Methods for Describing Sets of Data187 Questions
Exam 3: Probability284 Questions
Exam 4: Discrete Random Variables134 Questions
Exam 5: Continuous Random Variables138 Questions
Exam 6: Sampling Distributions52 Questions
Exam 7: Inferences Based on a Single Sample: Estimation With Confidence Intervals125 Questions
Exam 8: Inferences Based on a Single144 Questions
Exam 9: Inferences Based on Two Samples: Confidence Intervals and Tests of Hypotheses100 Questions
Exam 10: Analysis of Variance: Comparing More Than Two Means91 Questions
Exam 11: Simple Linear Regression113 Questions
Exam 12: Multiple Regression and Model Building131 Questions
Exam 13: Categorical Data Analysis60 Questions
Exam 14: Nonparametric Statistics Available Online87 Questions
Select questions type
Which of the following is not one of the multiple comparison method options available to compare treatment means?
(Multiple Choice)
4.8/5  (36)
(36)
A certain HMO is attempting to show the benefits of managed health care to an insurance company. The HMO believes that certain types of doctors are more cost-effective than others. One
Theory is that primary specialty is an important factor in measuring the cost-effectiveness of
Physicians. To investigate this, the HMO obtained independent random samples of 20 HMO
Physicians from each of four primary specialties-General Practice (GP), Internal Medicine (IM),
Pediatrics (PED), and Family Physician (FP)- and recorded the total per-member, per-month
Charges for each. In order to compare the mean charges for the four specialty groups, the data were
Be subjected to a one-way analysis of variance. The results of the Tukey analysis are summarized
Below. Group Sample Mean IM 55.9 GP 41.4 FP 39.50 PED 20.60
Which primary specialties have significantly lower mean charges than Internal Medicine (IM)?
(Multiple Choice)
4.8/5 (37)
A certain HMO is attempting to show the benefits of managed care to an insurance company. The HMO believes that certain types of doctors are more cost-effective than others. One theory is that
Certification level is an important factor in measuring the cost-effectiveness of physicians. To
Investigate this, the HMO obtained independent random samples of 29 physicians from each of the
Three certification levels-Board certified (C); Uncertified, board eligible (E); and Uncertified, board
Ineligible (I)-and recorded the total per-member, per-month charges for each (a total of 87
Physicians). In order to compare the mean charges for the three groups, the data will be subjected
To an analysis of variance. Give the degrees of freedom appropriate for conducting the ANOVA
F-test.
(Multiple Choice)
4.9/5 (47)
A local consumer reporter wants to compare the average costs of grocery items purchased at three different supermarkets, A, B, and C. Prices (in dollars)were recorded for a sample of 60 randomly
Selected grocery items at each of the three supermarkets. In order to reduce item-to-item variation,
The prices were recorded for each item on the same day at each supermarket. The results of a Bonferroni analysis are summarized below.
Supermarket A Mean Price 1.665 1.919 1.925
Interpret the Bonferroni analysis results.
(Multiple Choice)
4.8/5 (41)
Given that the sum of squares for error (SSE)for an ANOVA F-test is 12,000 and there are 40 total experimental units with eight total treatments, find the mean square for error (MSE).
(Multiple Choice)
4.8/5 (35)
A scientist is hoping to compare the mean levels of DDT toxin found in three species of fish in a local river. He randomly samples 50 of each species to use in the analysis. For each fish, he
Measures the amount of DDT toxin present. Ideally he will be able to rank the species based on the
Mean level of toxin found in each of the three species. Identify the treatments for this study.
(Multiple Choice)
4.8/5 (39)
An article in a journal examined the attitudes of three groups of professionals on the condition of the environment, and quantified their responses on a seven-point scale ( no problem to 7 = disaster very likely). The mean scores for the groups are: A: , B: , and C: . Using an experimentalwise error rate of , Tukey's minimum significance for comparing means is . Use this information to conduct a multiple comparisons of the means.
(Multiple Choice)
4.8/5 (40)
A study was conducted to test the effectiveness of supermarket sales strategies. At one supermarket, the price level (regular, reduced price, and at cost to supermarket)and display level
(normal display space, normal display space plus end-of-aisle display, and twice the normal
Display space)were tested to determine if they had any effect on the weekly sales of a particular
Supermarket product. Each of the combinations of price level and display level were put in place
For a randomly selected week and the weekly sales of the product was recorded. Each combination
Was used three times over the course of the experiment. The results of the study are shown here: 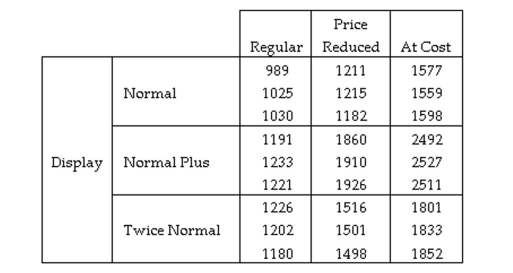 The ANOVA table is shown below:
Source DF SS MS F Display 2 1691393 845696 Price 2 3089054 1544527 Display*Price 4 510705 127676 Error 18 8905 495 Total 26 5300057
Find the test statistic for determining whether the interaction between Price and Display is
Significant.
The ANOVA table is shown below:
Source DF SS MS F Display 2 1691393 845696 Price 2 3089054 1544527 Display*Price 4 510705 127676 Error 18 8905 495 Total 26 5300057
Find the test statistic for determining whether the interaction between Price and Display is
Significant.
(Multiple Choice)
4.7/5 (35)
The randomized block design is an extension of the matched pairs comparison of μ1 and μ2.
(True/False)
4.8/5 (38)
A local consumer reporter wants to compare the average costs of grocery items purchased at three different supermarkets, A, B, and C. Prices (in dollars)were recorded for a sample of 60 randomly
Selected grocery items at each of the three supermarkets. In order to reduce item-to-item
Variation, the prices were recorded for each item on the same day at each supermarket. The results of the ANOVA test are summarized in the following table.
Source df Anova SS Mean Square F Value Pr > F Supermkt 2 2.6412678 1.3206399 39.23 0.0001 Item 59 215.5949311 3.6541514 108.54 0.0001 Error 118 3.9725322 0.0336655 Corrected Total 179 222.2087311
What is the value of the test statistic for determining whether the three supermarkets have the same average prices?
(Multiple Choice)
4.9/5 (40)
Find the critical value for a one-tailed test using , d.f. , and d.f. .
(Multiple Choice)
4.9/5 (36)
A city monitors ozone levels weekly over a 4 year period in order to relate the ozone levels to the seasons. Determine whether the study is observational or designed.
(Multiple Choice)
4.7/5 (40)
A beverage distributor wanted to determine the combination of advertising agency (two
levels)and advertising medium (three levels)that would produce the largest increase in
sales per advertising dollar. Each of the advertising agencies prepared ads as required for
each of the media-- newspaper, radio, and television. Twelve small towns of roughly the
same size were selected for the experiment, and two each were randomly assigned to
receive an advertisement prepared and transmitted by each of the six agency-medium
combinations. The dollar increases in sales per advertising dollar, based on a 1-month
sales period, are shown in the table. Advertising Medium Newspaper Radio Television Agency 1 15.3,12.7 17.4,20.1 16.2,12.7 Agency 2 22.4,18.9 24.3,28.8 12.5,9.4
The SPSS analysis is shown below.
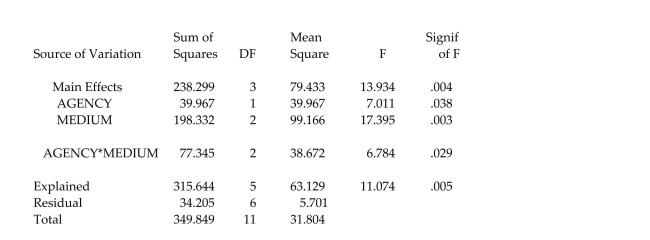 (Note: SPSS uses ʺExplainedʺ instead of ʺTreatmentʺ in the factorial analysis. Also, SPSS
uses ʺResidualʺ instead of ʺError.ʺ)Would you test the main effects factors, agency and
medium, in this example? Explain why or why not.
(Note: SPSS uses ʺExplainedʺ instead of ʺTreatmentʺ in the factorial analysis. Also, SPSS
uses ʺResidualʺ instead of ʺError.ʺ)Would you test the main effects factors, agency and
medium, in this example? Explain why or why not.
(Essay)
4.8/5 (35)
A study was conducted to test the effectiveness of supermarket sales strategies. At one supermarket, the price level (regular, reduced price, and at cost to supermarket)and display level
(normal display space, normal display space plus end-of-aisle display, and twice the normal
Display space)were tested to determine if they had any effect on the weekly sales of a particular
Supermarket product. Each of the combinations of price level and display level were put in place
For a randomly selected week and the weekly sales of the product was recorded. Each combination
Was used three times over the course of the experiment. The results of the study are shown here: 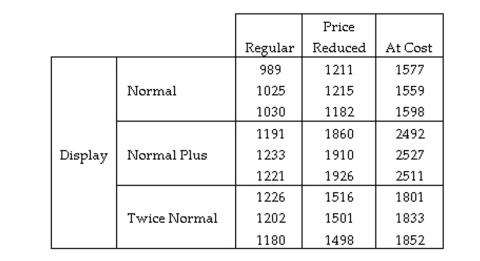 Identify the treatments used in this experiment.
(Multiple Choice)
5.0/5 (38)
307 diamonds were sampled and randomly sorted into three groups of diamonds. These diamonds were randomly assigned to one of the three organizations, or groups (HRD, GIA, or IGI), that
Certify the appraisal of diamonds. A study was conducted to determine if the average size of
Diamonds reported by these three certification groups differ. A completely randomized design was
Used and the resulting ANOVA table is shown below. One-Way AOV for CARAT by CERT
Source DF SS MS F P CERT 2 8.3265 4.16326 83.21 0.0000 Error 305 15.2604 0.05003 Total 307 23.5869
Give a practical conclusion for the test in the words of the problem. Use to make your conclusion.
(Multiple Choice)
4.8/5 (37)
Four brands of baseball bats were tested to determine which bat allowed hitters to hit a baseball farthest. Eight different batters were thrown 25 pitches while hitting with each of the four bats
(assigned in random order). The average distance of the five longest hits using each bat is shown
In the table below. The goal is to determine if the average hit distance differs for the four brands of
Baseball bats. Batter Brand 1 Brand 2 Brand 3 Brand 4 1 307 315 300 275 2 310 317 305 285 3 335 335 330 302 4 325 328 320 300 5 300 305 295 270 6 345 350 340 310 7 312 315 308 300 8 298 302 295 288 How should the data be analyzed?
(Multiple Choice)
4.8/5 (43)
Consider a completely randomized design with k treatments. Assume all pairwise comparisons of treatment means are to be made using a multiple comparisons procedure. Determine the total
Number of treatment means to be compared for the value k = 4.
(Multiple Choice)
4.9/5 (42)
A local consumer reporter wants to compare the average costs of grocery items purchased at three different supermarkets, A, B, and C. Prices (in dollars)were recorded for a sample of 60 randomly
Selected grocery items at each of the three supermarkets. In order to reduce item-to-item
Variation, the prices were recorded for each item on the same day at each supermarket. The results of the ANOVA are summarized in the following table.
Source df Anova SS Mean Square F Value Pr > F Supermkt 2 2.6412678 1.3206399 39.23 0.0001 Item 59 215.5949311 3.6541514 108.54 0.0001 Error 118 3.9725322 0.0336655 Corrected Total 179 222.2087311
Based on the -value of the test, make the proper conclusion.
(Multiple Choice)
4.9/5 (32)
Filters
- Essay(0)
- Multiple Choice(0)
- Short Answer(0)
- True False(0)
- Matching(0)