Exam 2: Frequency Distributions and Graphs
Exam 1: The Nature of Probability and Statistics81 Questions
Exam 2: Frequency Distributions and Graphs107 Questions
Exam 3: Data Description127 Questions
Exam 4: Probability and Counting Rules173 Questions
Exam 5: Discrete Probability Distributions117 Questions
Exam 6: The Normal Distribution114 Questions
Exam 7: Confidence Intervals and Sample Size122 Questions
Exam 8: Hypothesis Testing178 Questions
Exam 9: Testing the Difference Between Two Means, Two Variances, and Two Proportions99 Questions
Exam 10: Correlation and Regression73 Questions
Exam 11: Other Chi-Square Tests73 Questions
Exam 12: Analysis of Variance69 Questions
Exam 13: Nonparametric Statistics62 Questions
Exam 14: Sampling and Simulation58 Questions
Select questions type
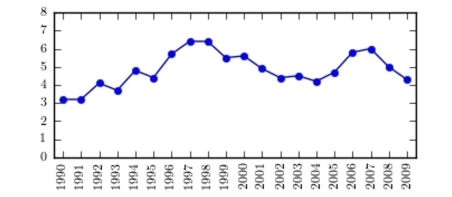
The following time-series plot presents the population growth (in percent) of a suburb of Atlanta, Georgia for each of the years 1990 through 2009 . Estimate the rate of growth in
(Multiple Choice)
4.8/5  (44)
(44)
The three most commonly used graphs in research are the histogram, the
, and the cumulative frequency graph (ogive).
(Short Answer)
4.8/5 (39)
The following table presents the rate of population growth of a suburb of Atlanta, Georgic of the years 1990 through 2009 . Construct a time-series plot of the growth rate.
Year Percent Growth Year Percent Growth 1990 3.1 2000 5.5 1991 3.3 2001 5.2 1992 4.3 2002 4.4 1993 3.5 2003 4.2 1994 4.4 2004 4.1 1995 5.7 2005 4.7 1996 5.2 2006 5.9 1997 6.4 2007 6.2 1998 5.6 2008 5.2 1999 5.8 2009 4.6
(Multiple Choice)
4.7/5 (32)
One hundred students are shown an eight-digit number on a piece of cardboard for three seconds and are asked to then recite the number from memory. The process is repeated until the student accurately recites the entire number from memory. The following histogi presents the number of trials it took each student to memorize the number.
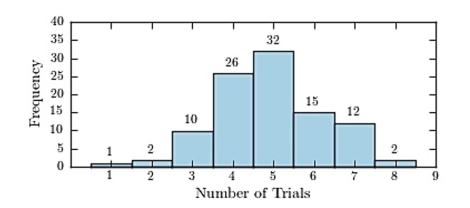 How many students memorized the number in three trials or less?
(Multiple Choice)
4.9/5 (40)
The following frequency distribution presents the weights in pounds (lb) of a sample of visitors to a health clinic.
Clinic Visitor Weights Weight (lb) Frequency 120-129 4 130-139 13 140-149 23 150-159 42 160-169 32 170-179 24 180-189 9 190-199 3
Construct a relative frequency histogram.
(Multiple Choice)
5.0/5 (36)
A weatherman records the amount of rain that fell in Portland, Oregon each day for a year. What type of graph should he use to show how rainfall changes during the year?
(Multiple Choice)
4.7/5 (30)
For a given data set, the ogive and the frequency polygon will have the same overall
shape.
(True/False)
4.7/5 (37)
Construct a dotplot for the following data.
16 13 14 12 15 13 14 14 12 12 14 13 13 14 12 13 15 14 12 16
(Multiple Choice)
4.9/5 (37)
A time series graph is useful for detecting trends that occur over the period of time.
(True/False)
4.9/5 (37)
The following frequency distribution presents the frequency of passenger vehicles that pa: through a certain intersection from 8:00 AM to 9:00 AM on a particular day.
Vehicle Type Frequency Motorcycle 8 Sedan 87 SUV 88 Truck 31
Construct a relative frequency distribution for the data.
(Multiple Choice)
4.9/5 (38)
The cumulative frequency for a class is the sum of the frequencies of the classes less
than and equal to the upper boundary of the specific class.
(True/False)
4.7/5 (41)
A sample of 200 high school students were asked how many hours per week they spend u television. The following frequency distribution presents the results.
Time Spent Watching Television Number of hours Frequency 0.0-3.9 71 4.0-7.9 59 8.0-11.9 32 12.0-15.9 18 16.0-19.9 18 20.0-23.9 2
Construct a relative frequency ogive for the frequency distribution. watching
(Multiple Choice)
4.8/5 (28)
When two sets of data collected over specific periods of time are compared on the same
graph using two lines, it is called a compound time series graph.
(True/False)
4.8/5 (41)
Construct a pie chart for the following distribution: Year in School Number of Students Freshmen 28 Sophomores 14 Juniors 40 Seniors 18
(Essay)
4.7/5 (35)
A time series graph is useful for which of the following purposes?
(Multiple Choice)
4.7/5 (37)
Filters
- Essay(0)
- Multiple Choice(0)
- Short Answer(0)
- True False(0)
- Matching(0)